


In this lesson, we'll emphasize some of the improvements we made to the web server.
When starting a new process, the incoming calls will not wait for that process to be started, that request will be assigned to the first available process, which is likely not the new process with an existing process. So basically, we made the starting of processes an asynchronous thing. And this makes the response times more stable. We also made the disposing of processes that are not needed, because the load has dropped, smarter. So instead of dropping all processes at once, it will basically slowly degrade the size of the pool over a longer period of time. And it will actually base this on the load. So it keeps statistics. And when the load gets below a certain point, it will start disposing processes until it reaches the minimum size of the pool, or the pool size matches the load that is on the web server.
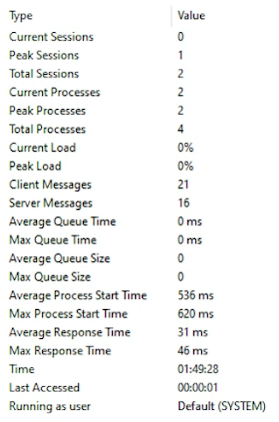
We have some new statistics like load indicators, web startup times average response times. And we're showing some other things like the process IDs
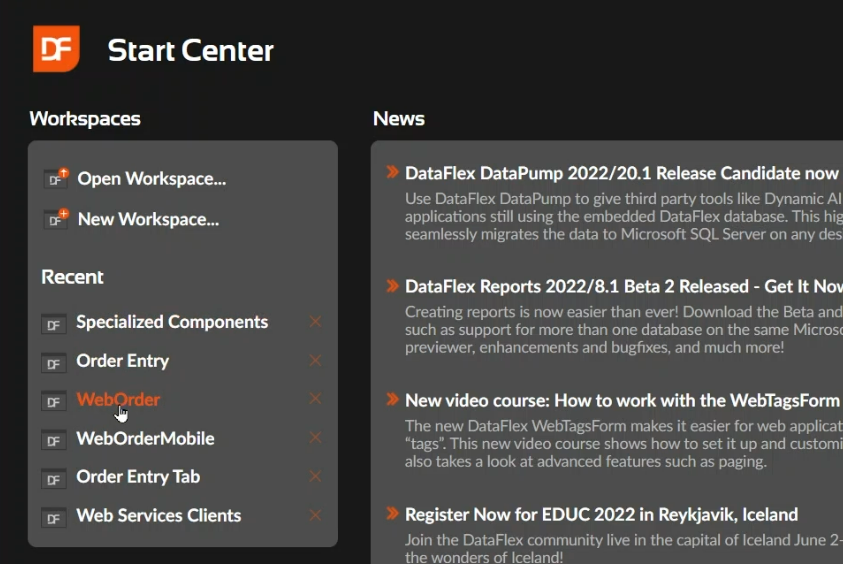
Let's take a look at an example, open the WebOrder workspace
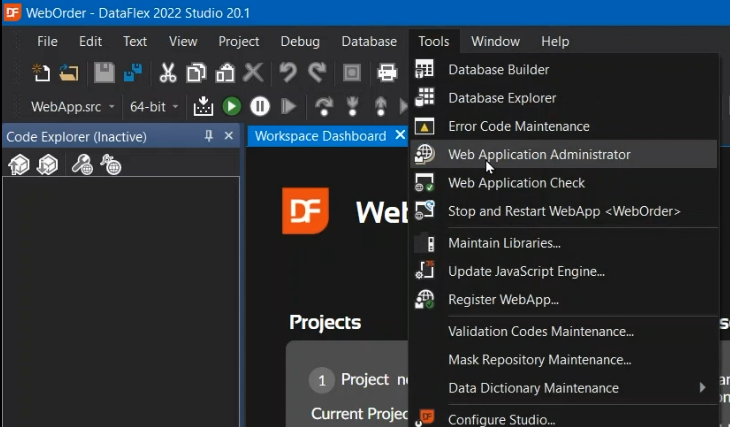
And open the Web Administrator.
So now we see that if you select a web application, that on the right, you have a longer list of Statistics. For example, it shows here, the average process startup time, the effort prep process started time for this application is around 600 milliseconds, so about half a second. We also see that currently there is no load on this server, it says current load is 0%. And the peak load has been at 23%. We also see efforts response time being 13 milliseconds, and the maximum response time is 85 seconds, milliseconds. So this is the response time, the time it takes for web server to handle an HTTP request. Of course, this does not include the network communication, because that's outside of the scope of the web server.
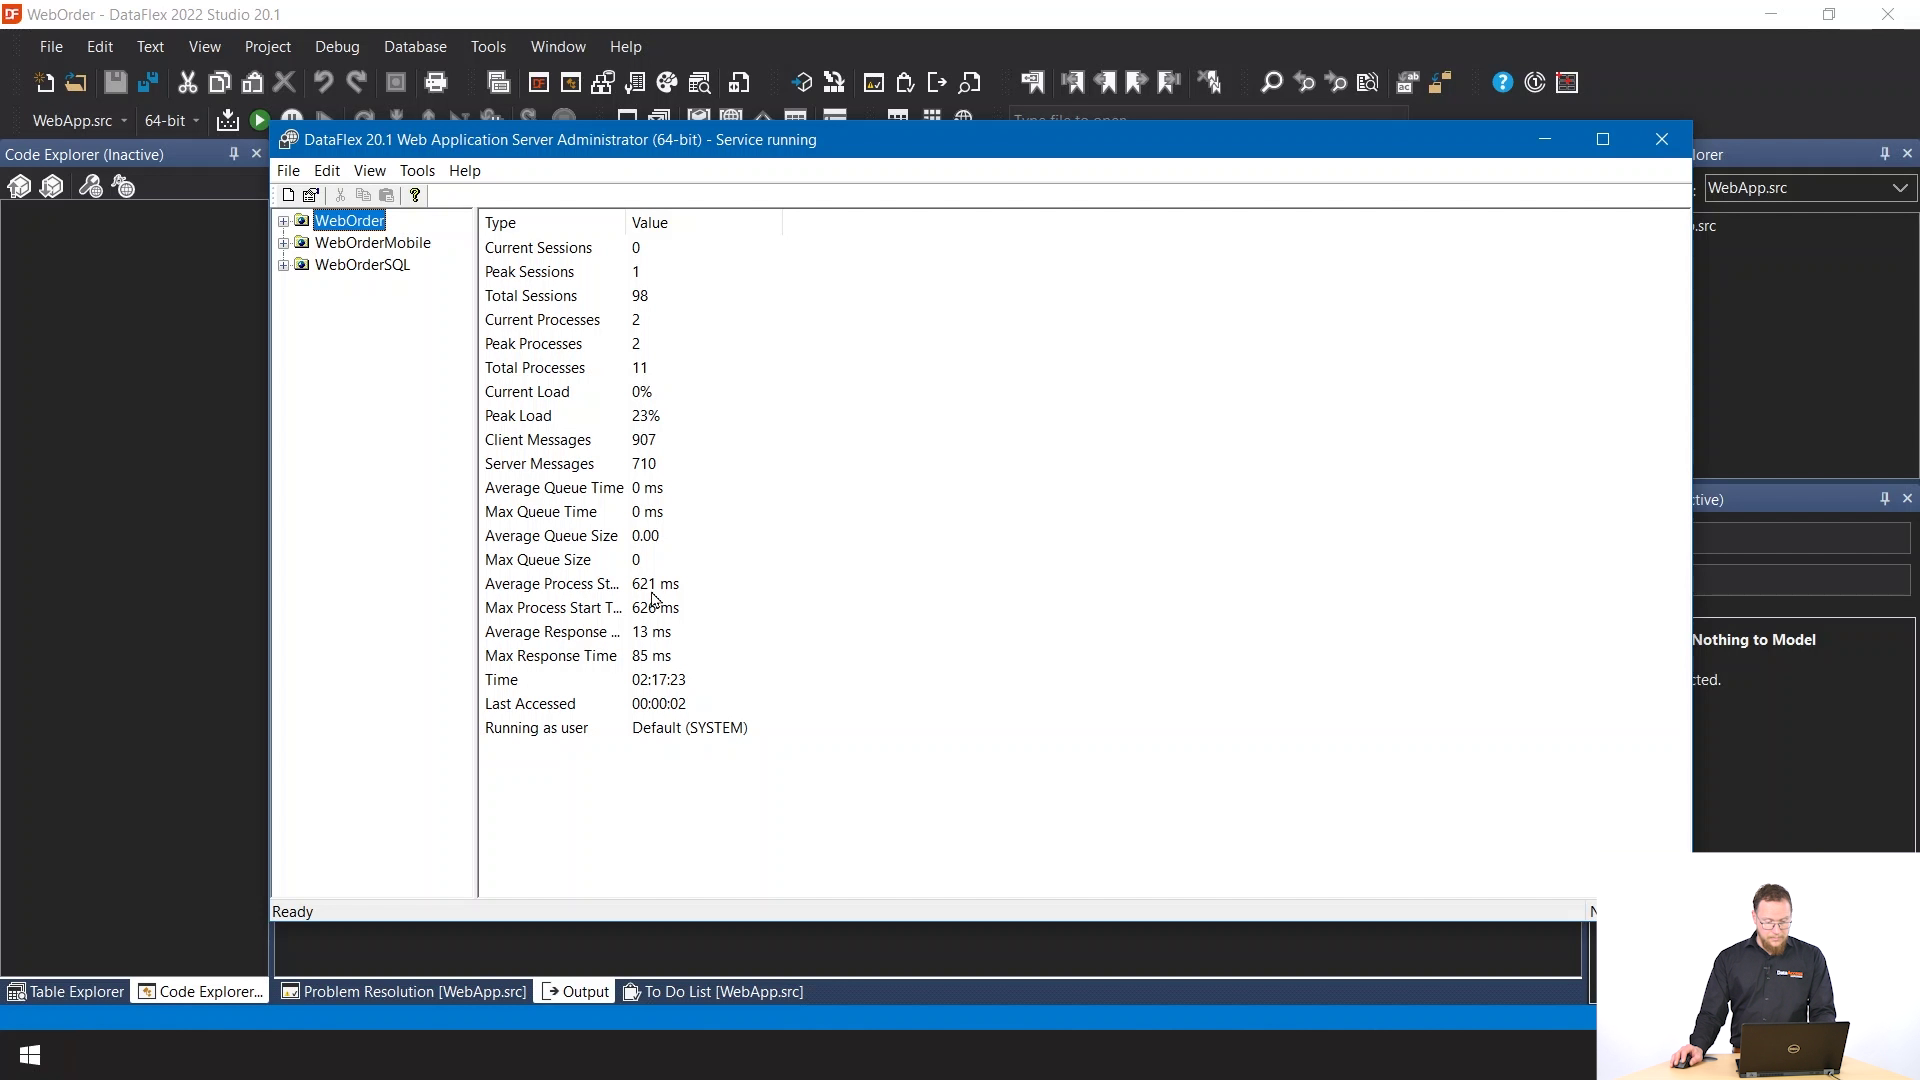
If we look at this SQL application, for example, we see that starting of SQL applications is a little slower because it has to connect to SQL Server and has to do more things.

.png)
This API can best be seen by looking at the specialized components workspace.
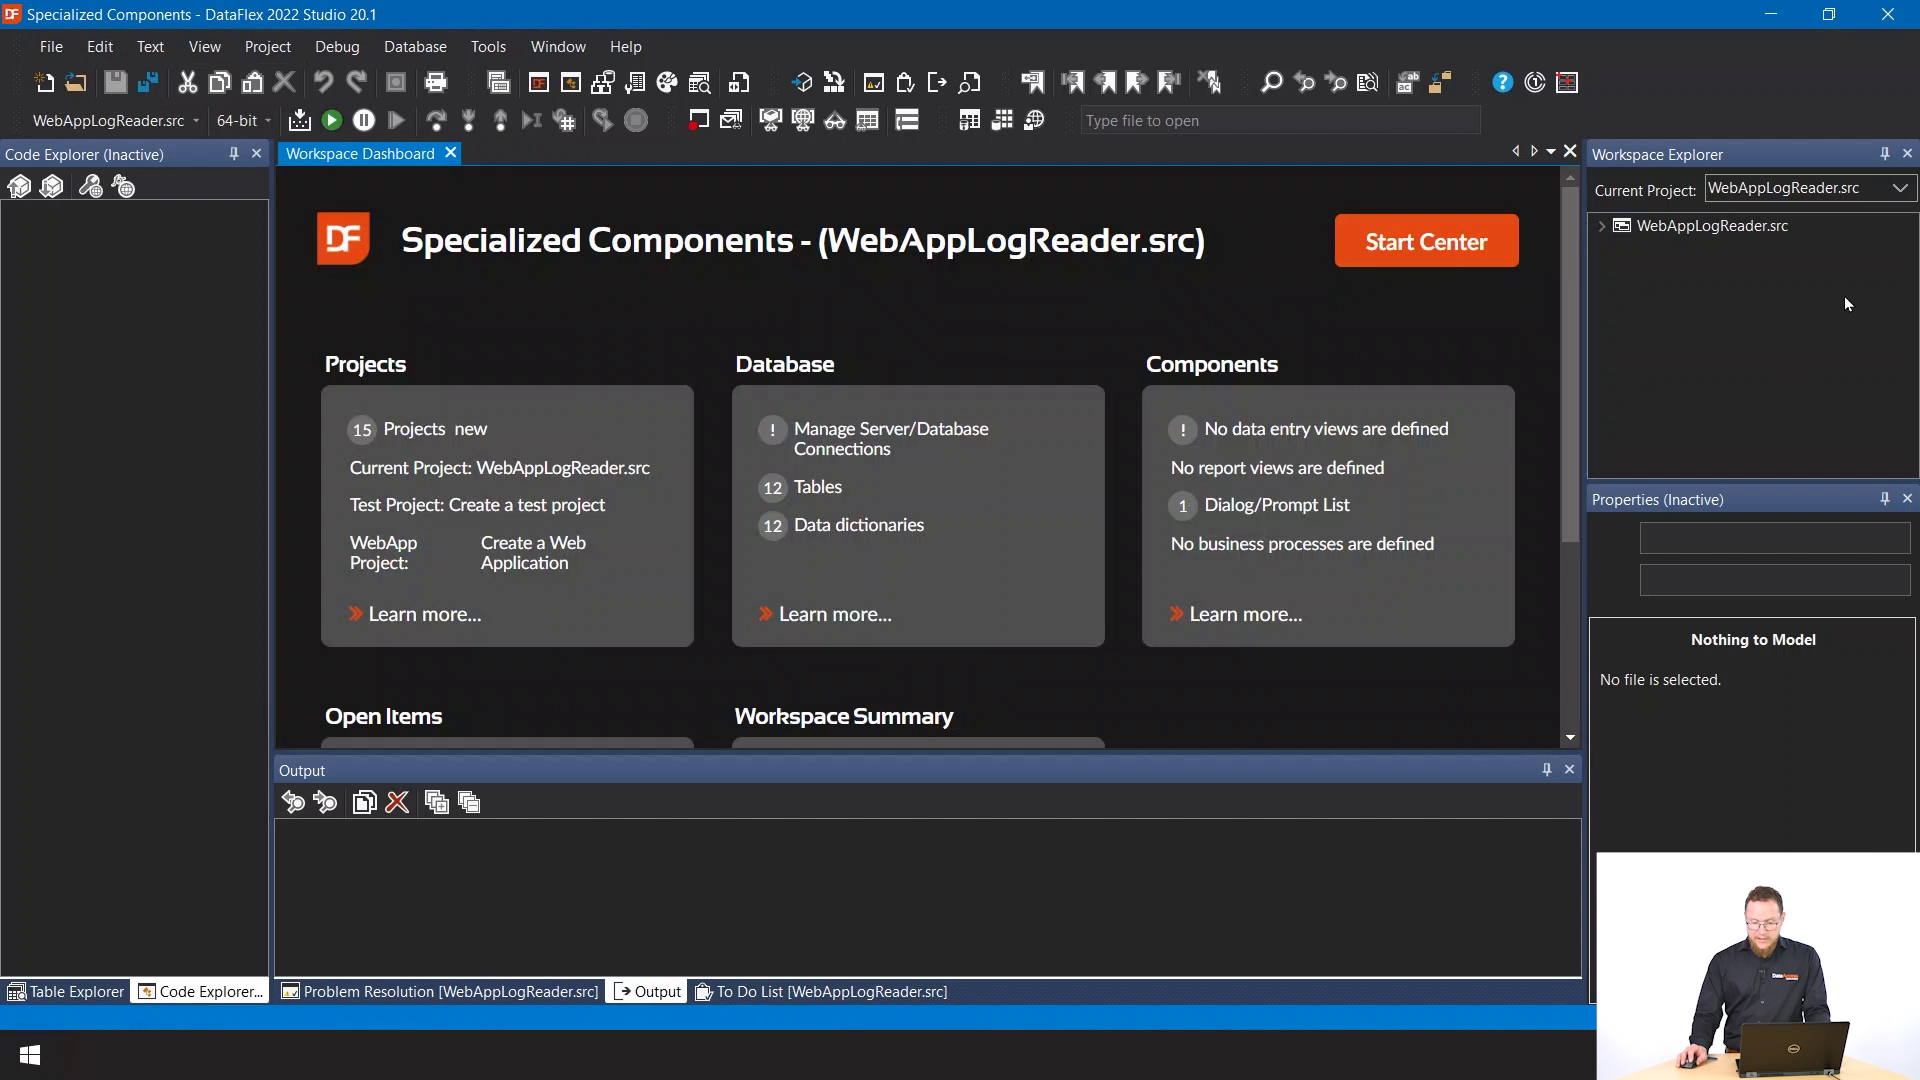
Here is a project WebAppLogReader.src and if you run that, you get this view.
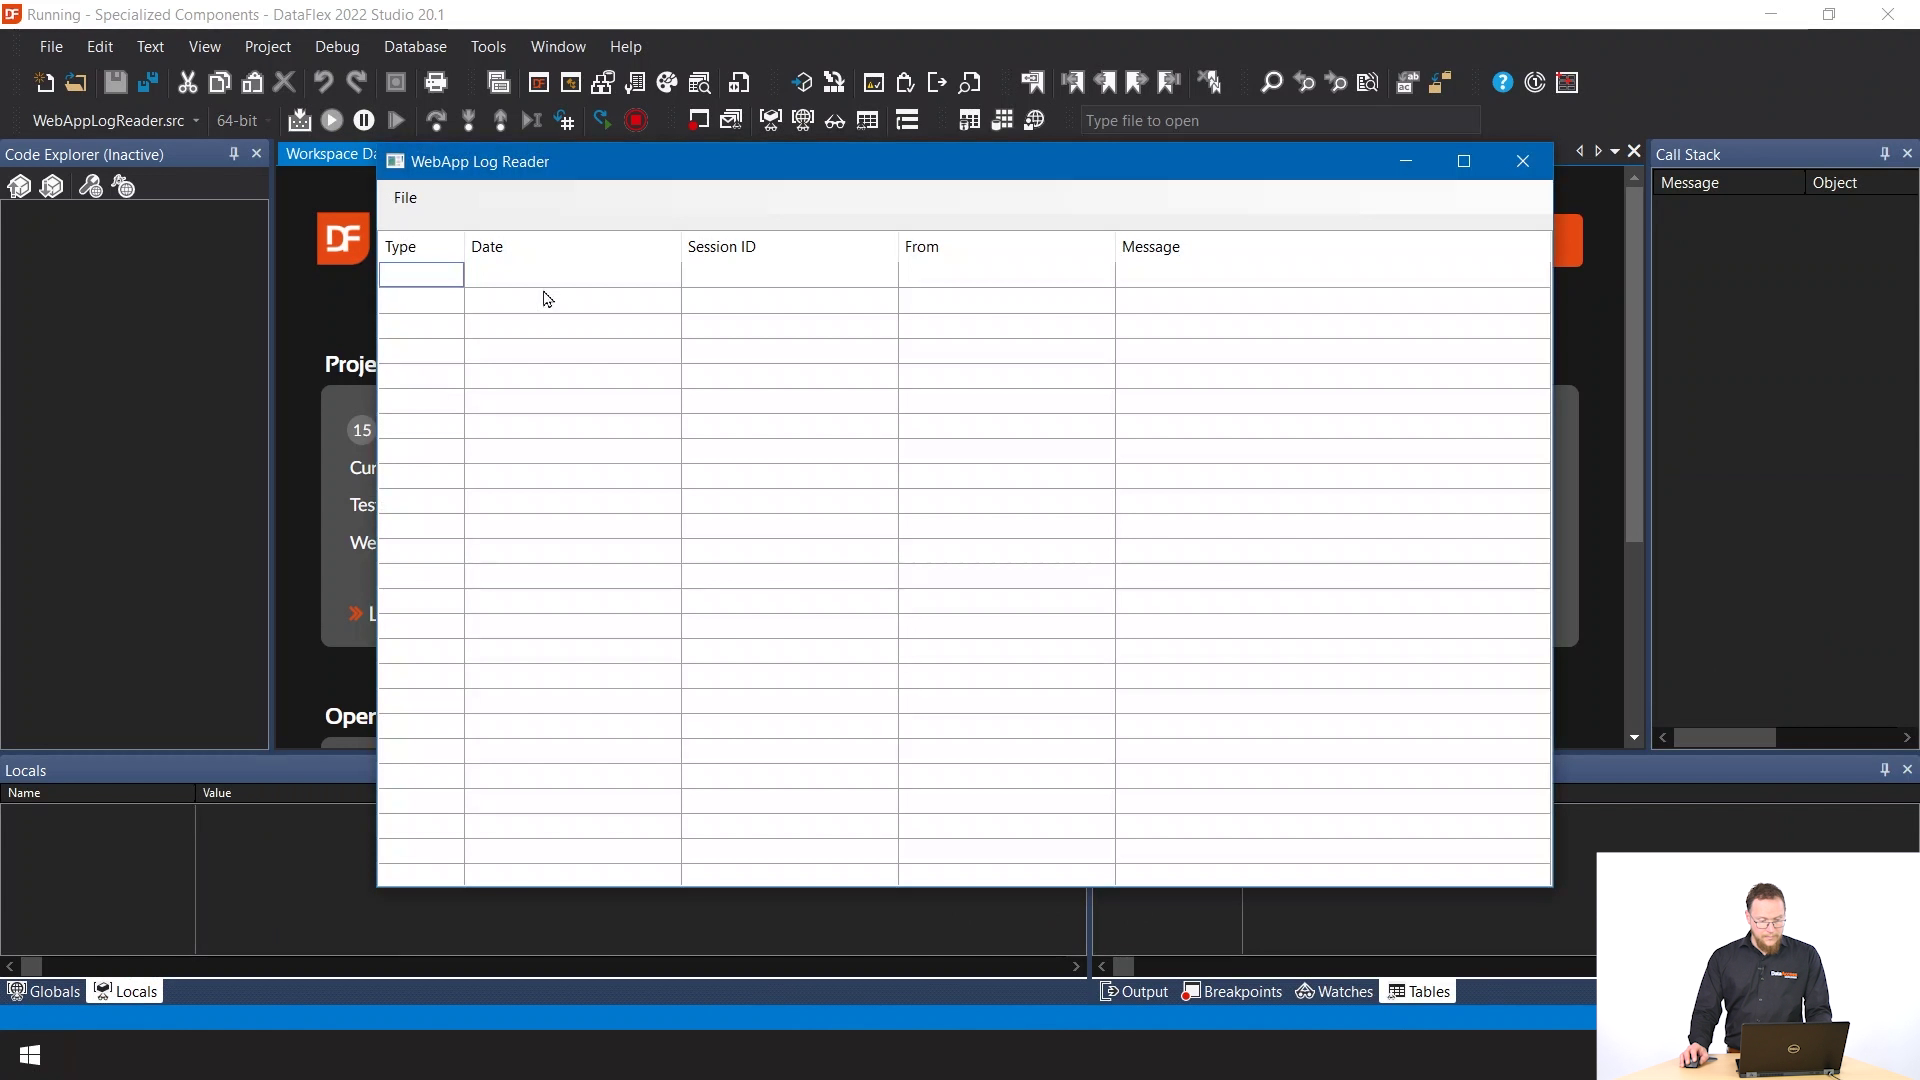
And it has the option to open a log from disk or from a running web app. So if you open a running web app, it shows you a list of all the active web apps.
.png)
.png)
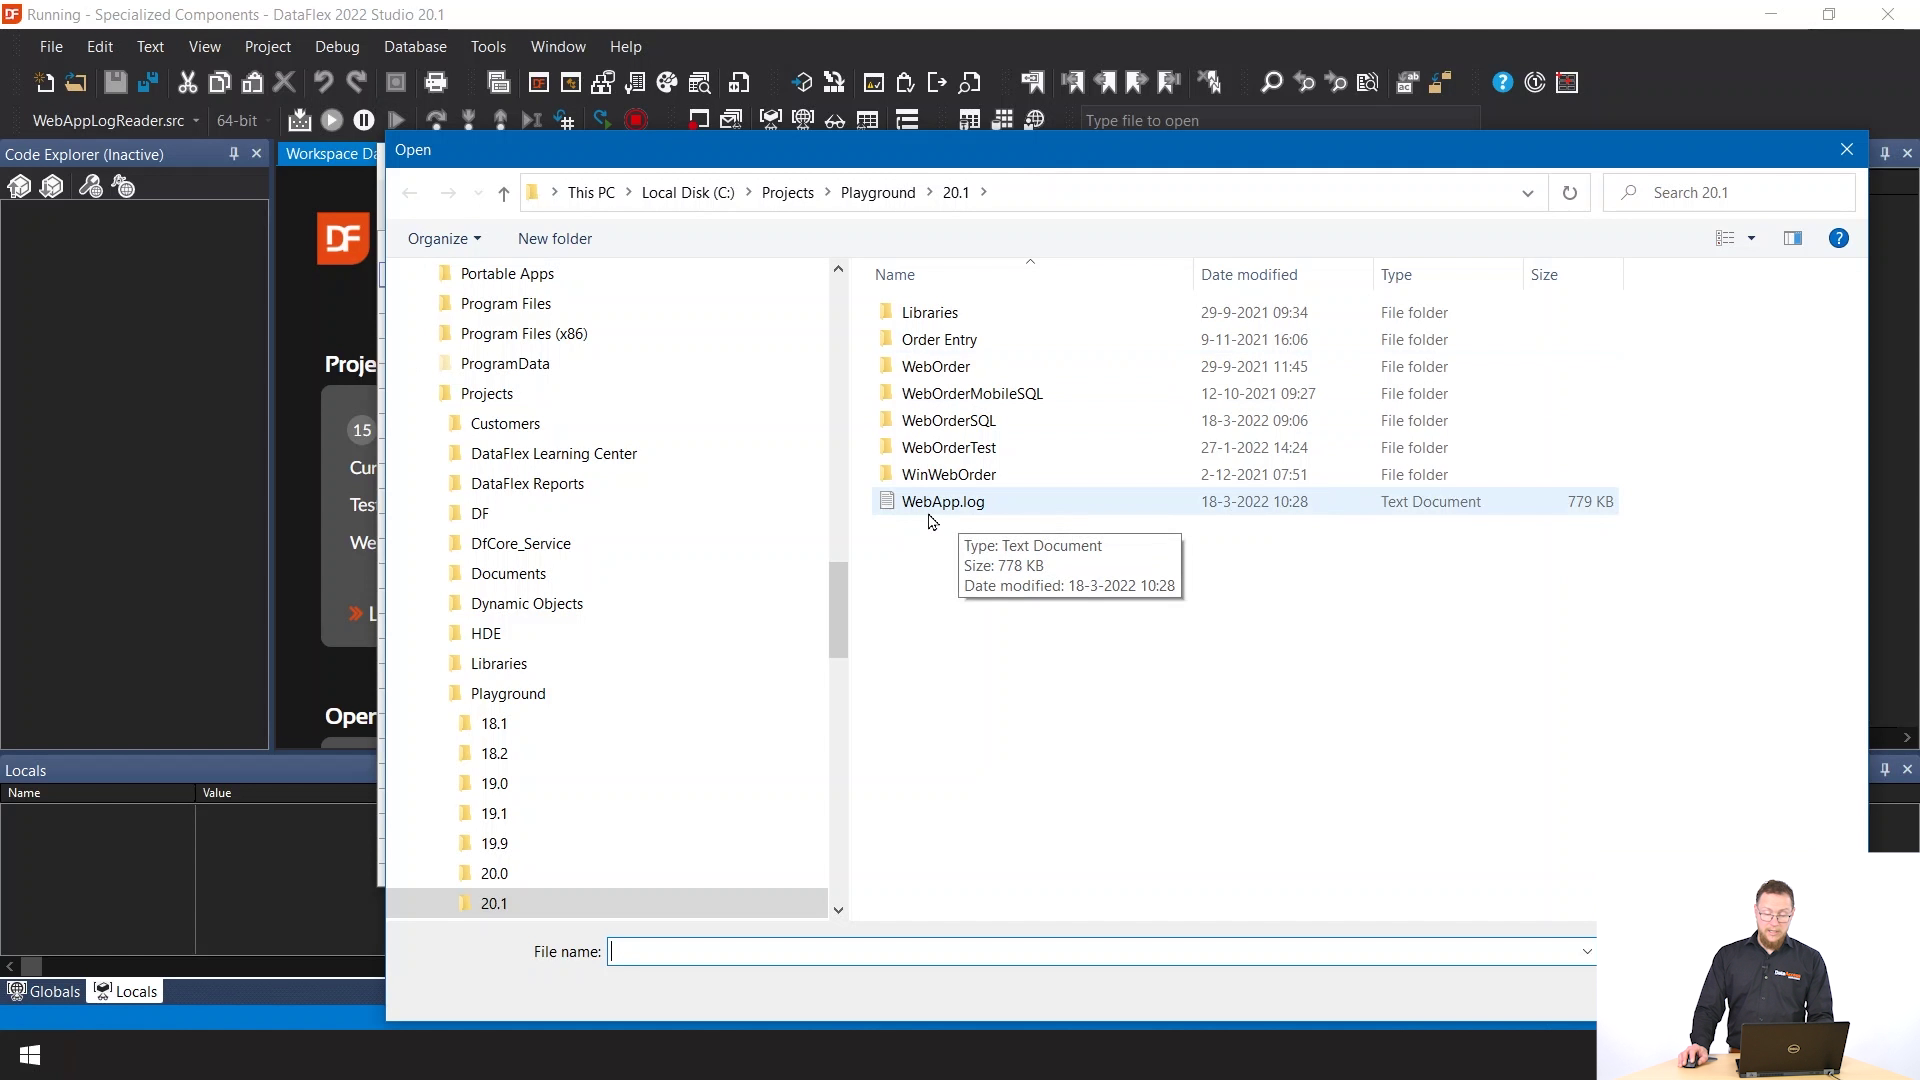
You can also choose to open from disk, I have a copy of a WebApp.log here that I'm going to open.
As you can see this replication has had some errors and all the sessions are actively logged here.
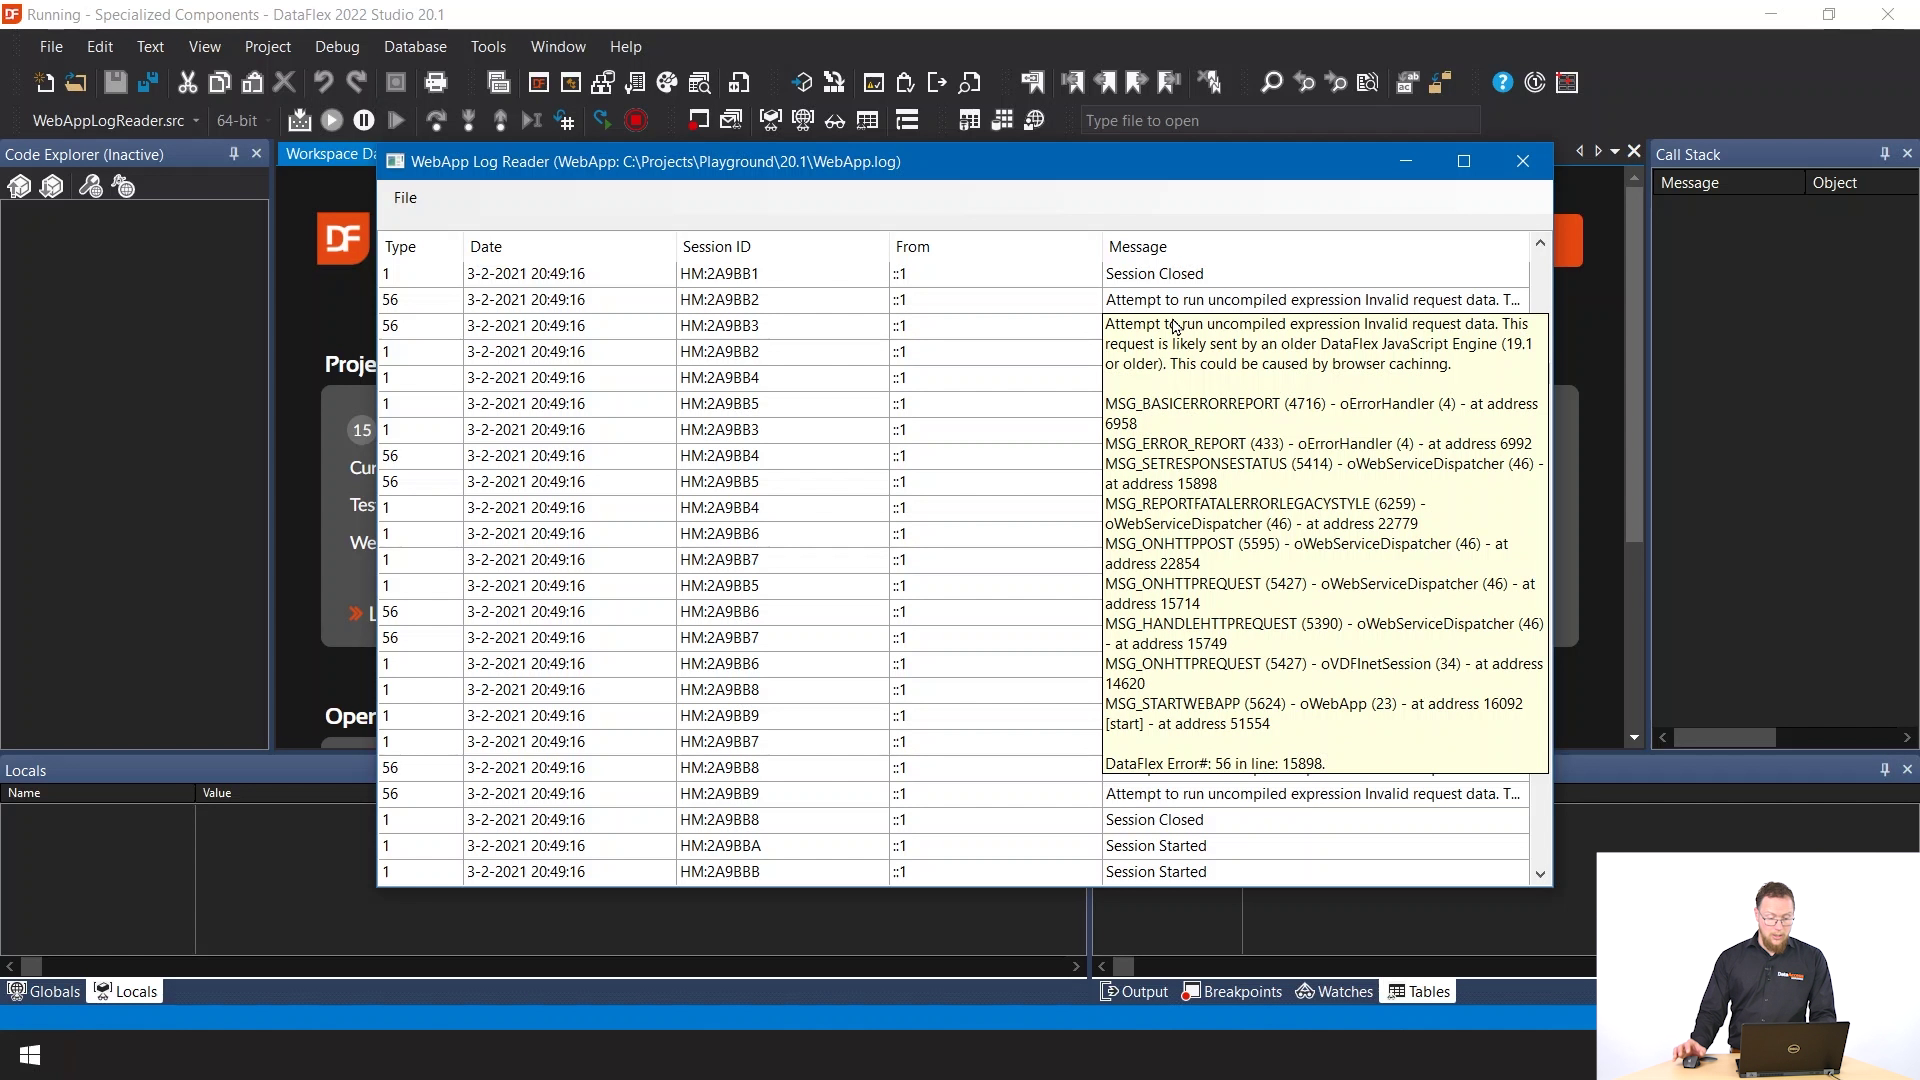
You can use this to analyze log files that you downloaded from one of your deployment servers. Or if you have a customer that sends you one, you can now use this little tool to open it. And because it's all DataFlex source, you can also implement your own tools to work with these log files.
