Using the troubleshooting tool DataFlex Diagnostics
Lesson 2 - Running DataFlex Diagnostics
In the previous lesson, we downloaded and installed DataFlex Diagnostics. In this lesson, we will run DataFlex Diagnostics of one of my systems to analyze my environment.
DEMONSTRATION
- Right click and run as administrator
- The administrator will have rights to everything that is being analyzed. So you want to see if all the settings are correct
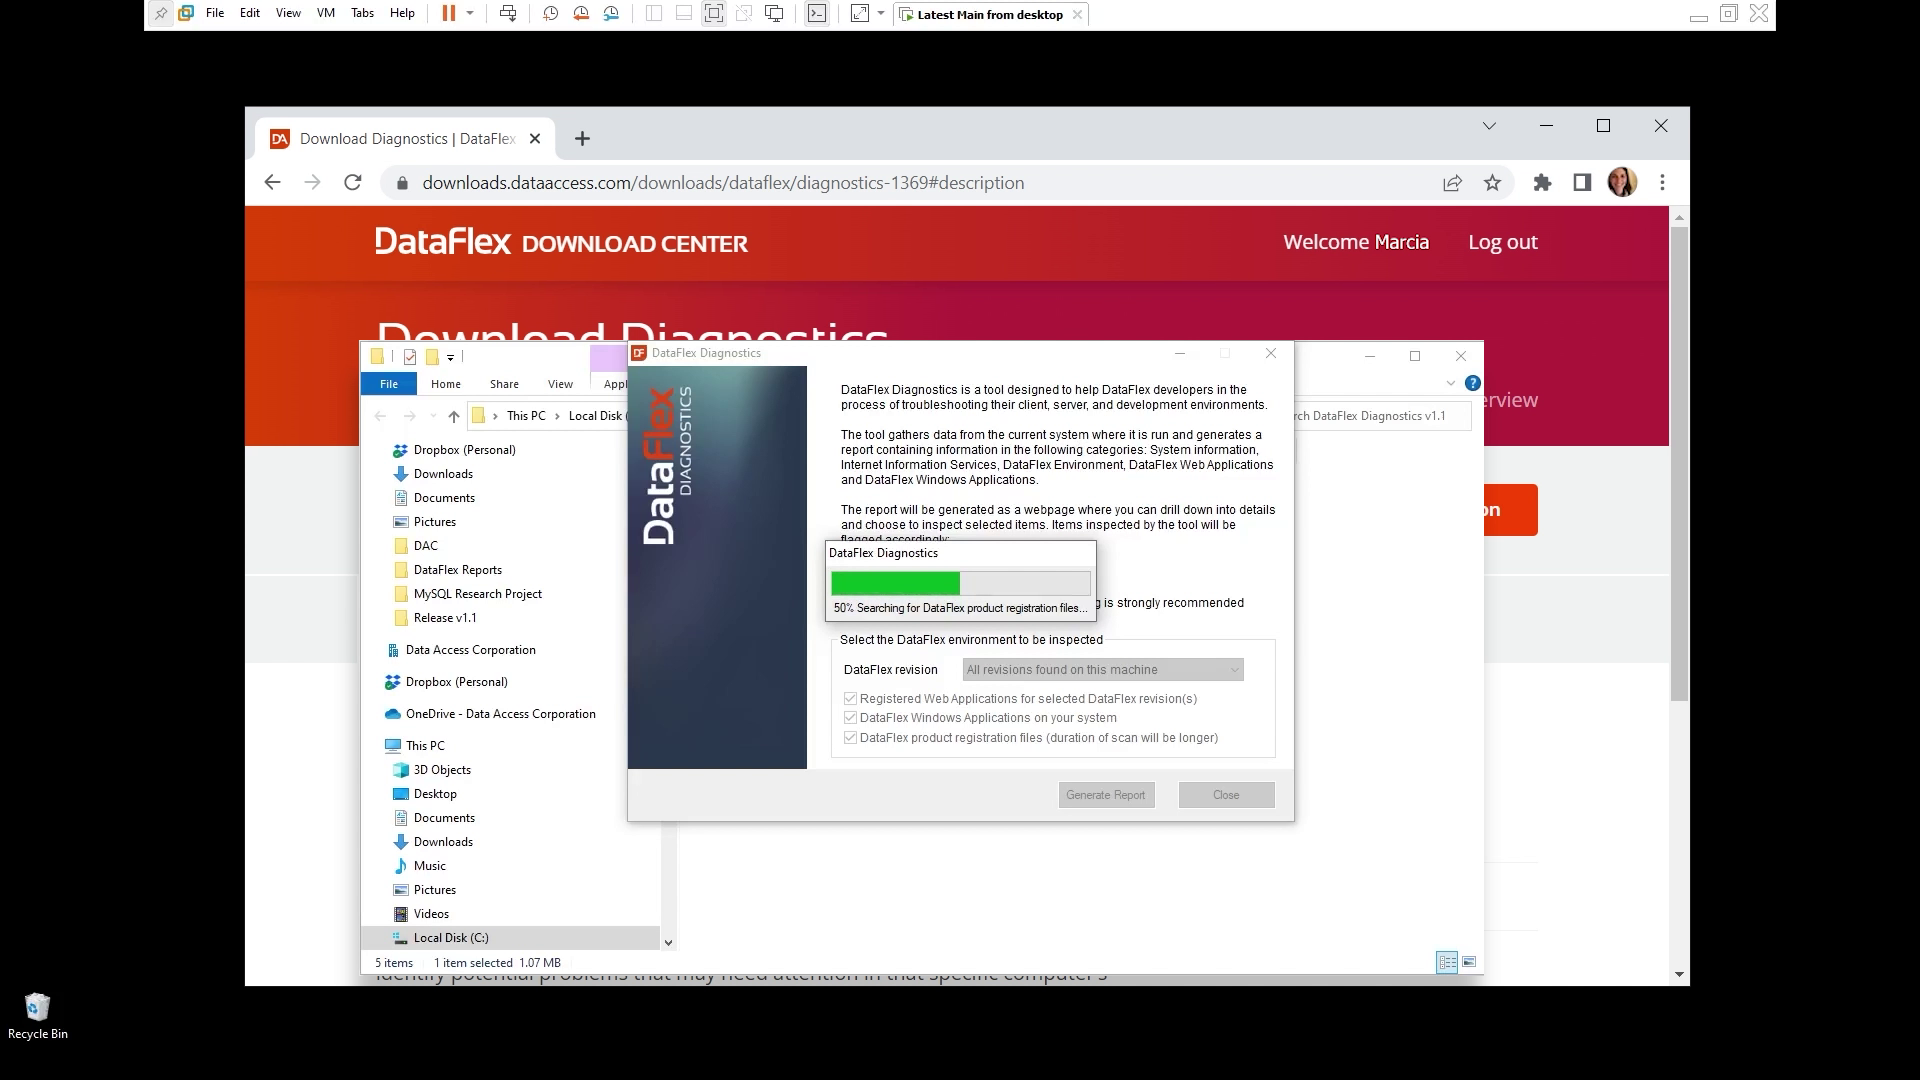
- It comes up with the main screen of DataFlex Diagnostics
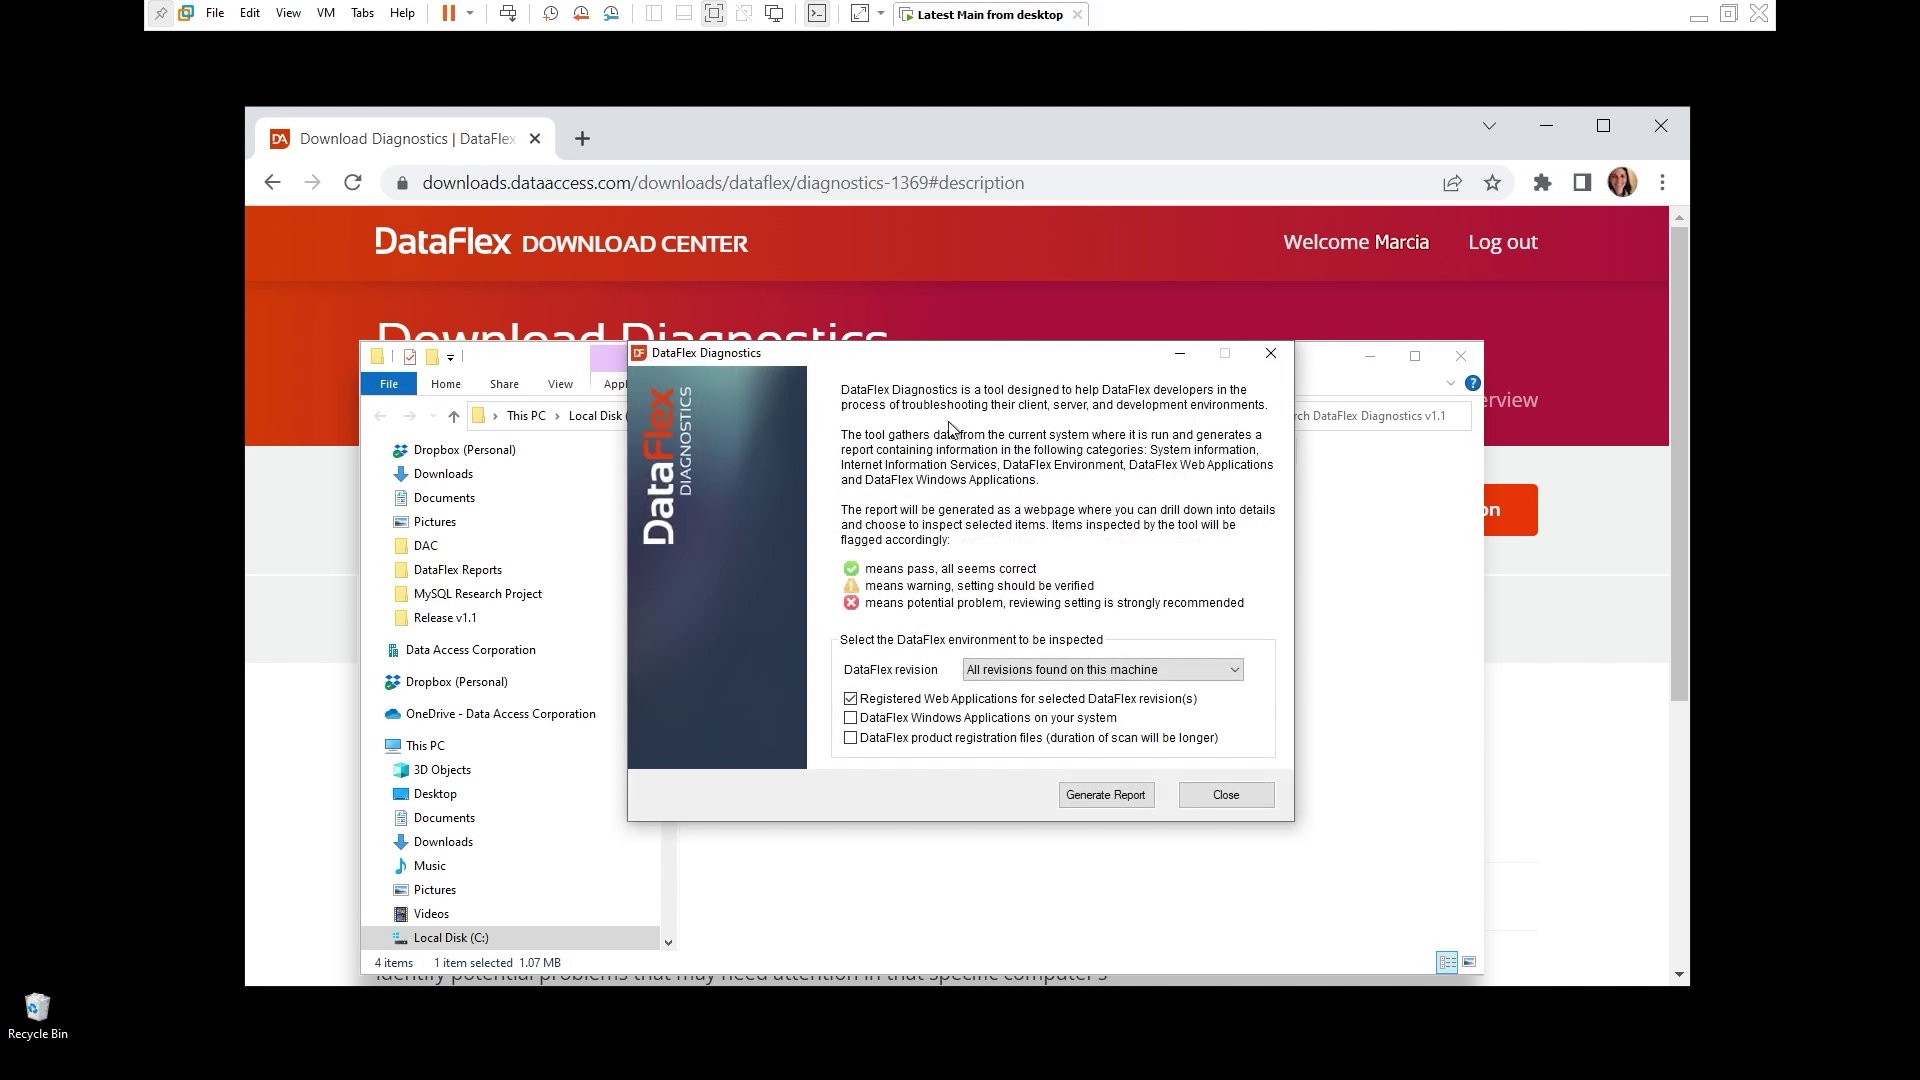
- There's a little bit of an explanation of what the tool is going to be doing
- And you the flags so you know what is going to happen. Each one of the items will be flagged as
- a warning, something that you might want to take a look into that
- the red X, something wrong. So this is this is a problem, a warning, it might not affect you, but maybe you it's a good idea to look into it
- a green check is a pass
- Under the flags is the group of options that you can use on the report:
- the first one you can select what you want to do, the DataFlex revision, what revisions do you want to look into. All revisions that may be found on this machine, or you just want to select some something specific.
- analyze the Registered Web applications, so you check that if you want to analyze the web applications that you have
- The next option is Windows application. So it will look for DataFlex Windows application that are here on their on your system
- The last one, this may take a little longer. So you might want to run this one when you do have time or you do have a registration problem only.
- So we're going to check this one that is the Windows application. So we'll see what it shows on the report. And the DataFlex product registration files, this will scan your system for all the registration files that it can find
- Now click on Generate Report
- This dialog shows up when you select a DataFlex Windows application
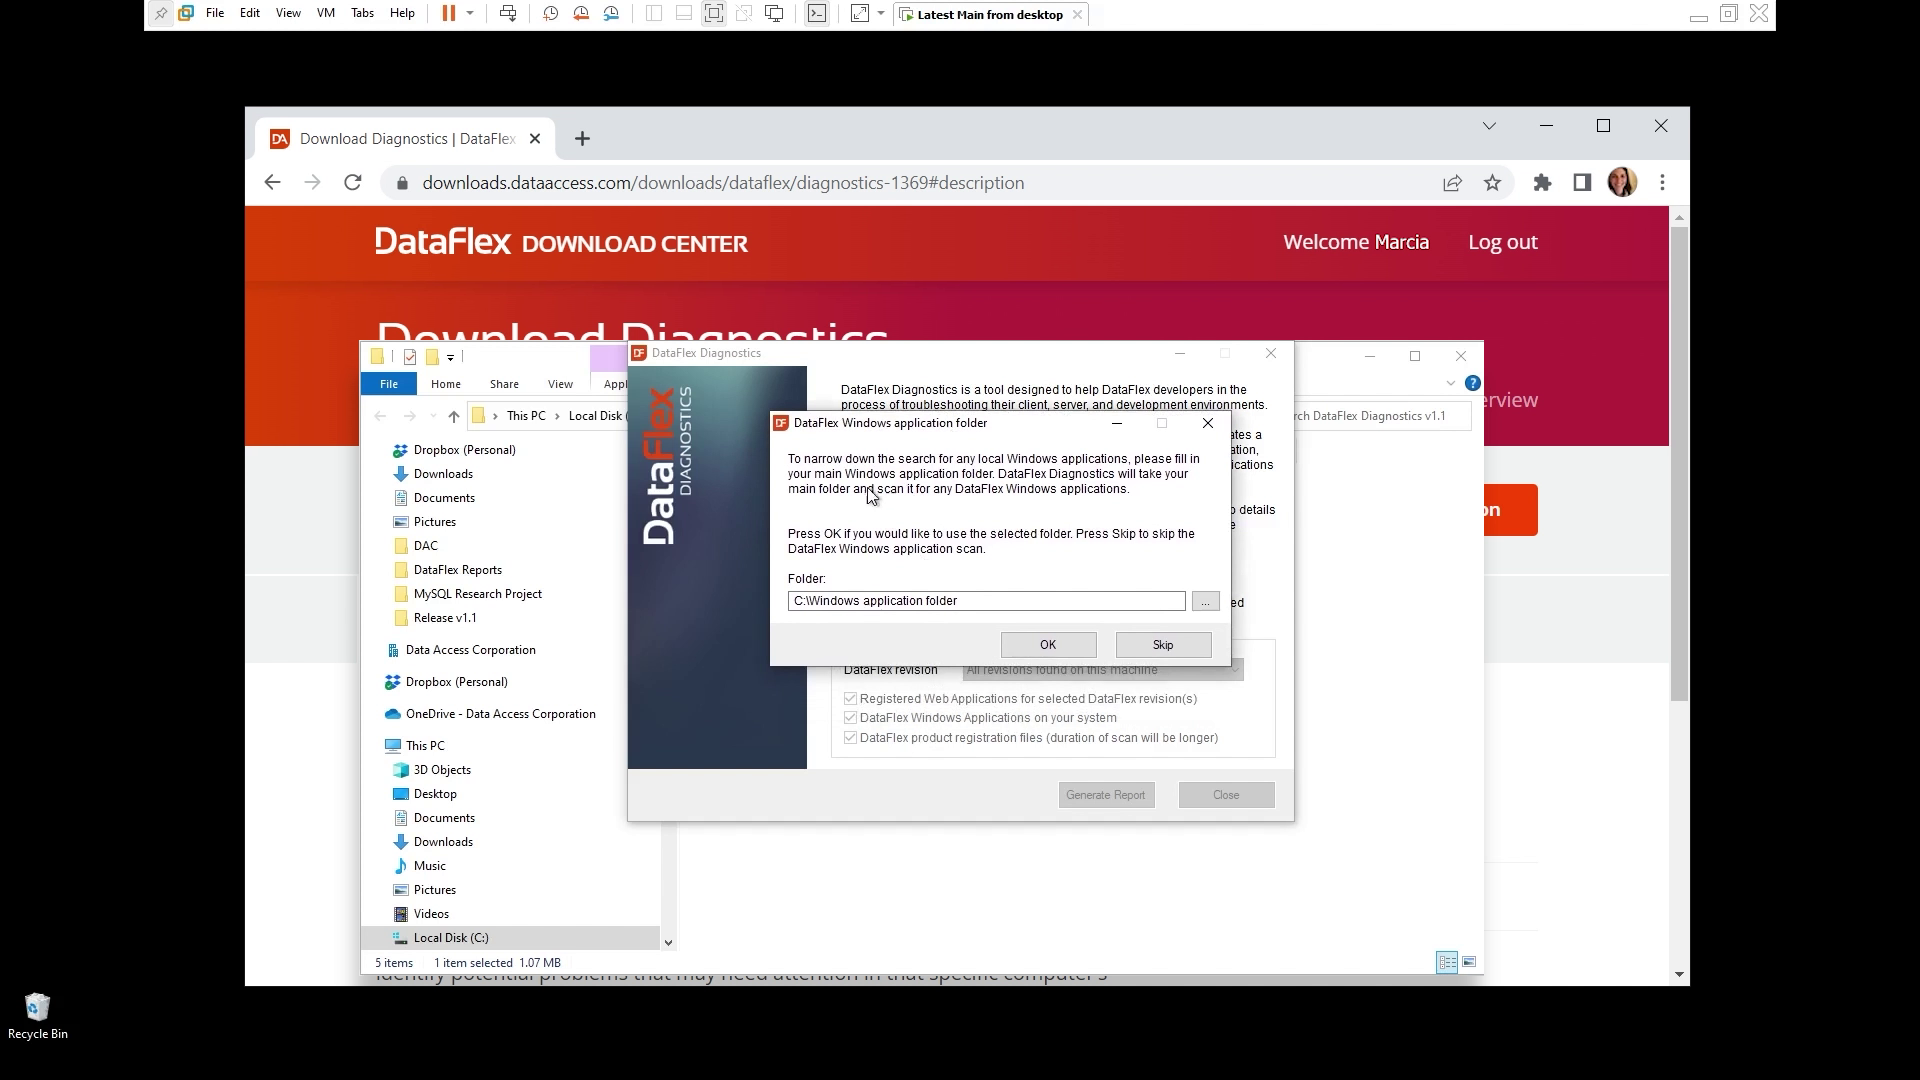
- So here it prompts you to select where to start. Normally you have like DataFlex workspaces, you can organize in a folder so instead of just going through all your system, you can just select the starting point
- Now I will choose the 20.0 examples. So this will be our folder
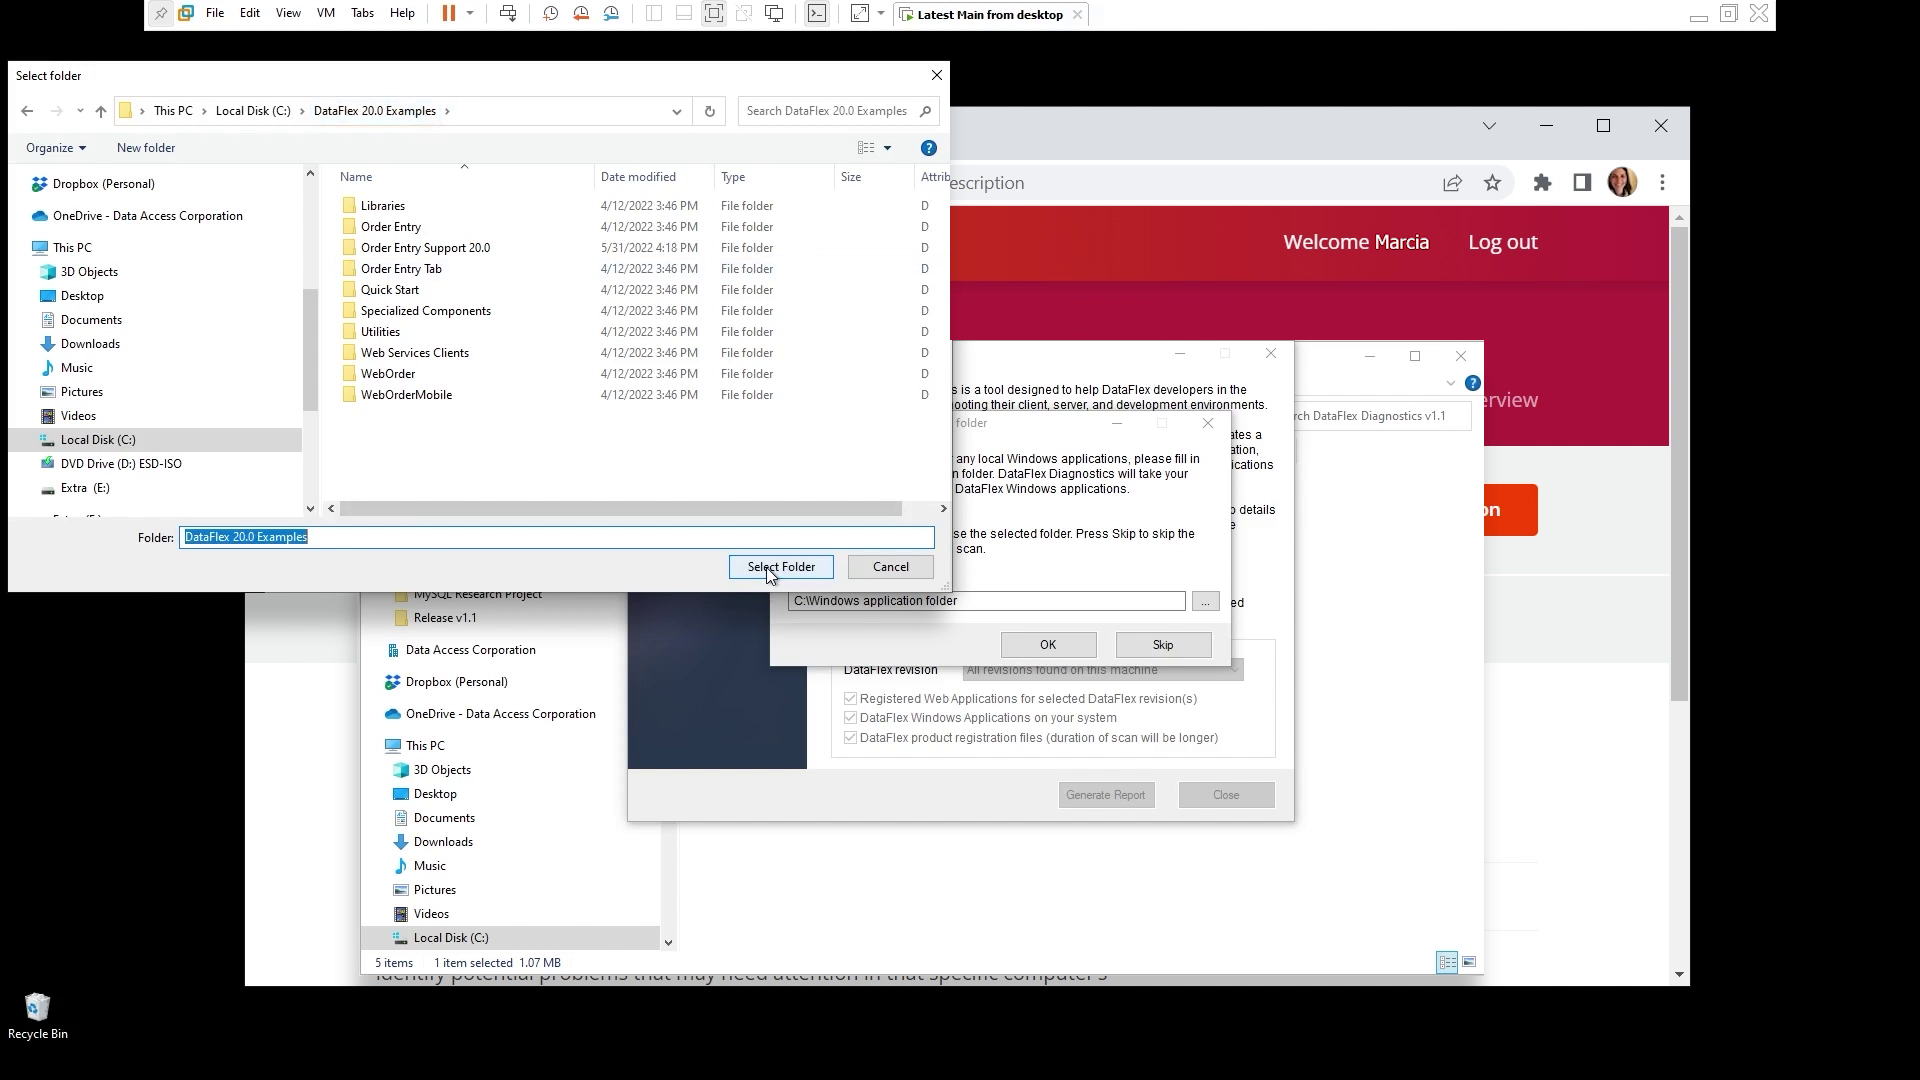
- And I'll click OK

- And the tool starts to work on analyzing all your information. This will take a little bit
- And you can see here on the screen, some information about how you can rerun
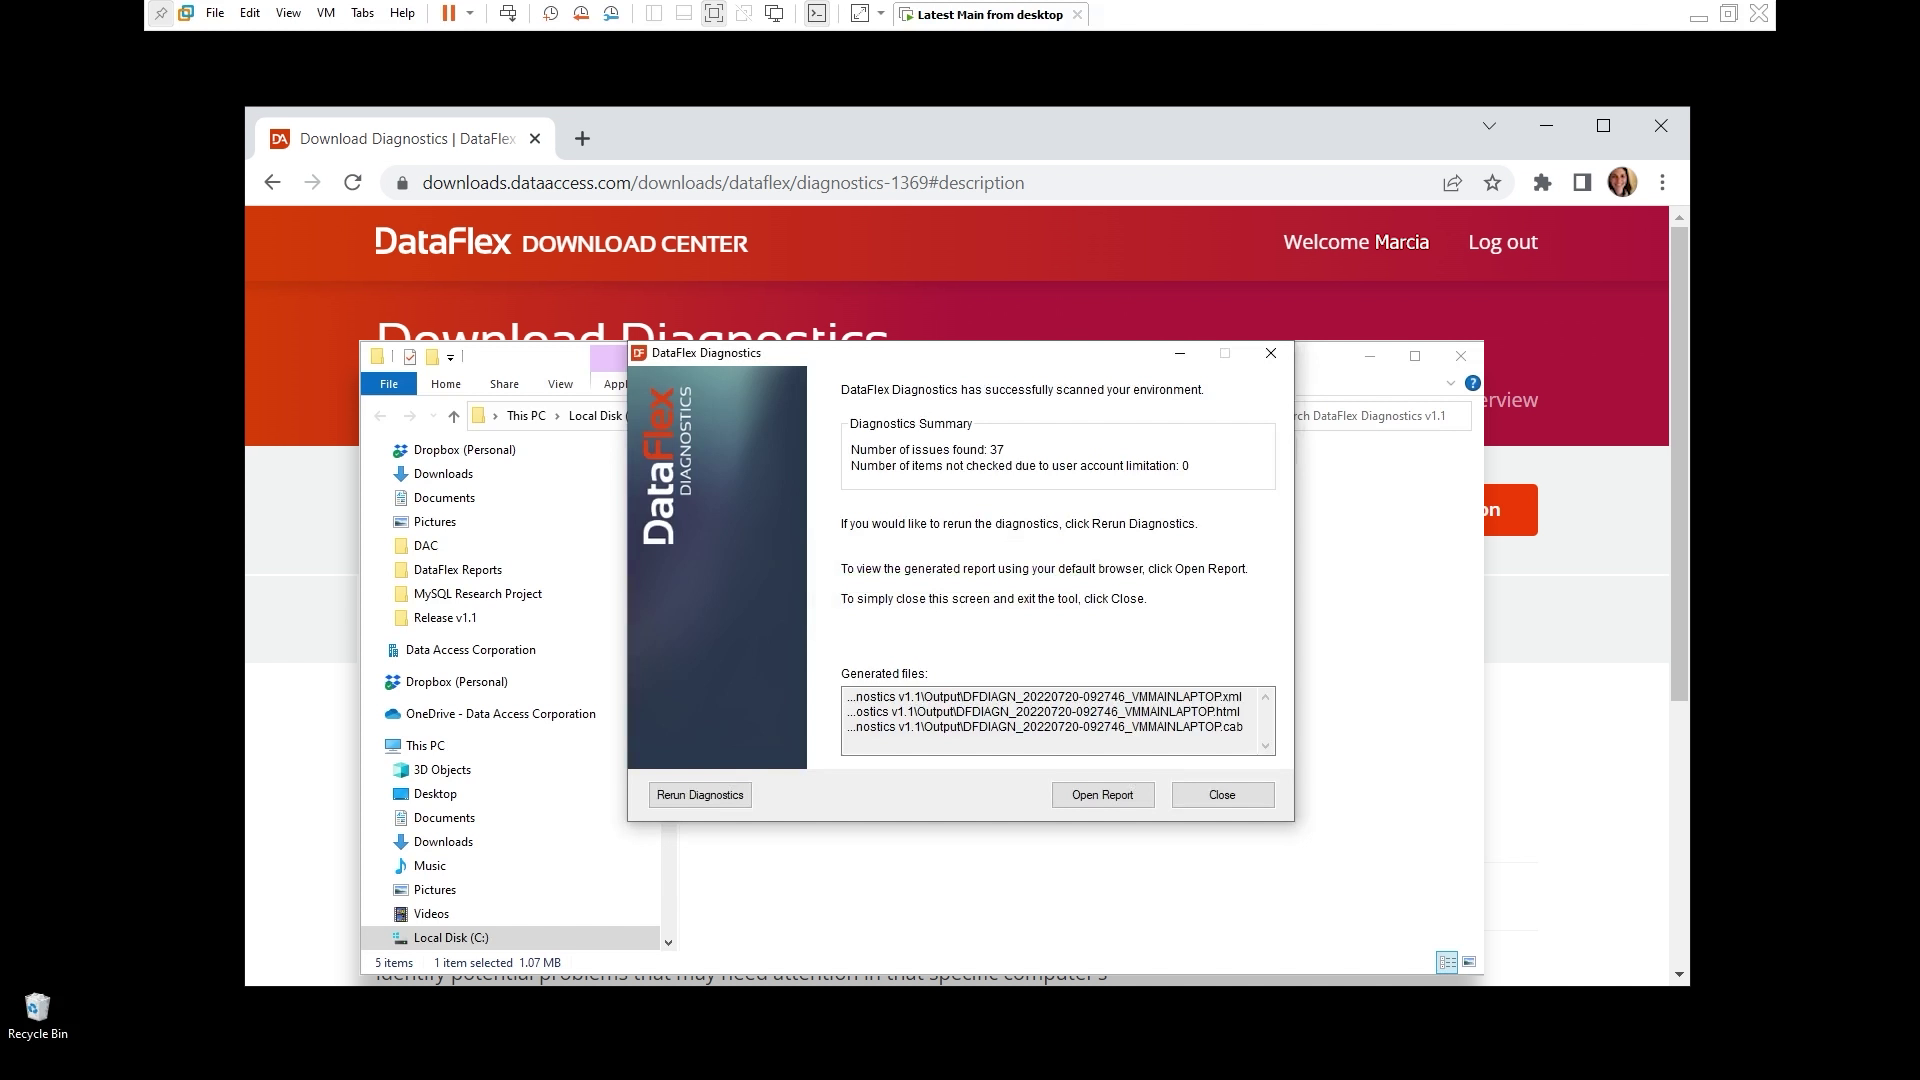
- You can just click to rerun the diagnostics, if you would like to. You see a list of files that got generated. And you can open the report.
- When you go to the DataFlex Diagnostics folder you see the this is the the output folder
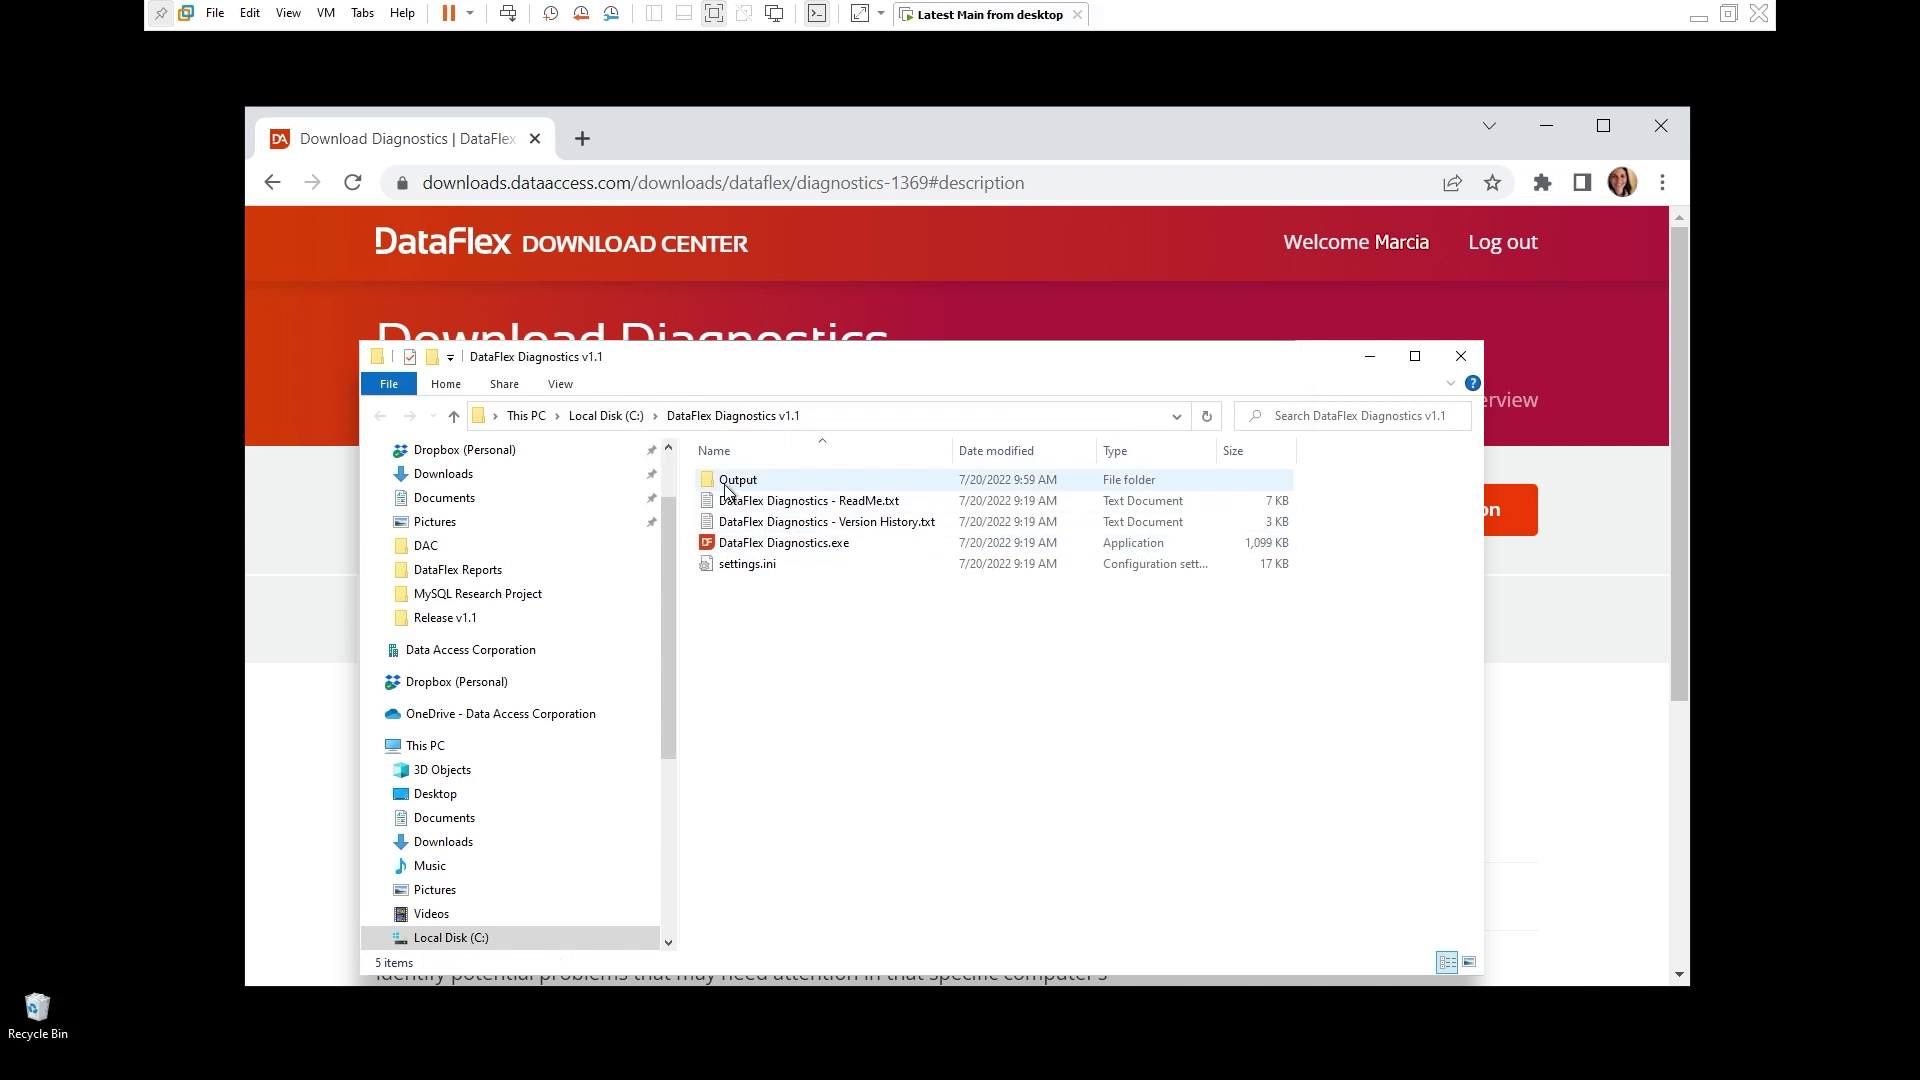
- Here we have the different files that can be distributed
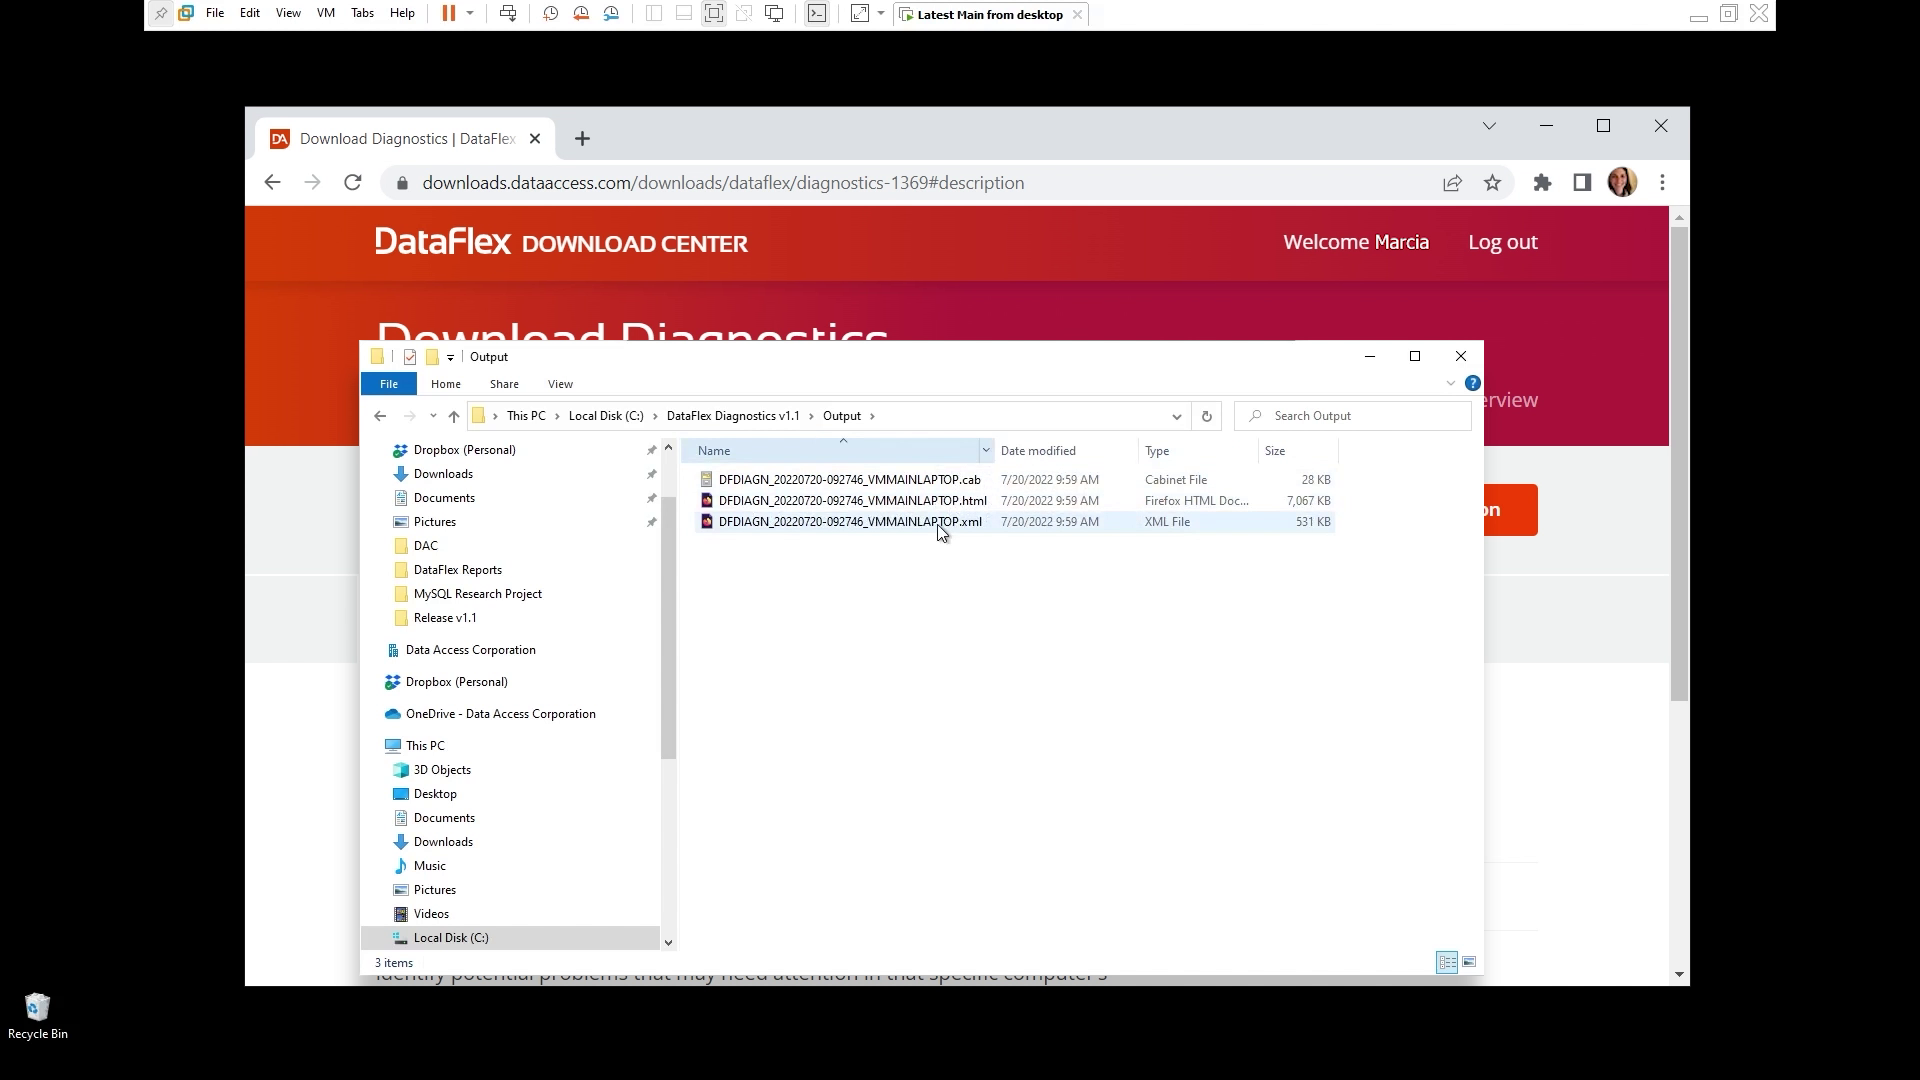
- The html file is the complete report, so any browser can open up this file
- We also deliver the .cab, this is if you need to email the file
- And there is the XML file. That will we'll look into for sharing. We'll look into this a little bit in the next lesson
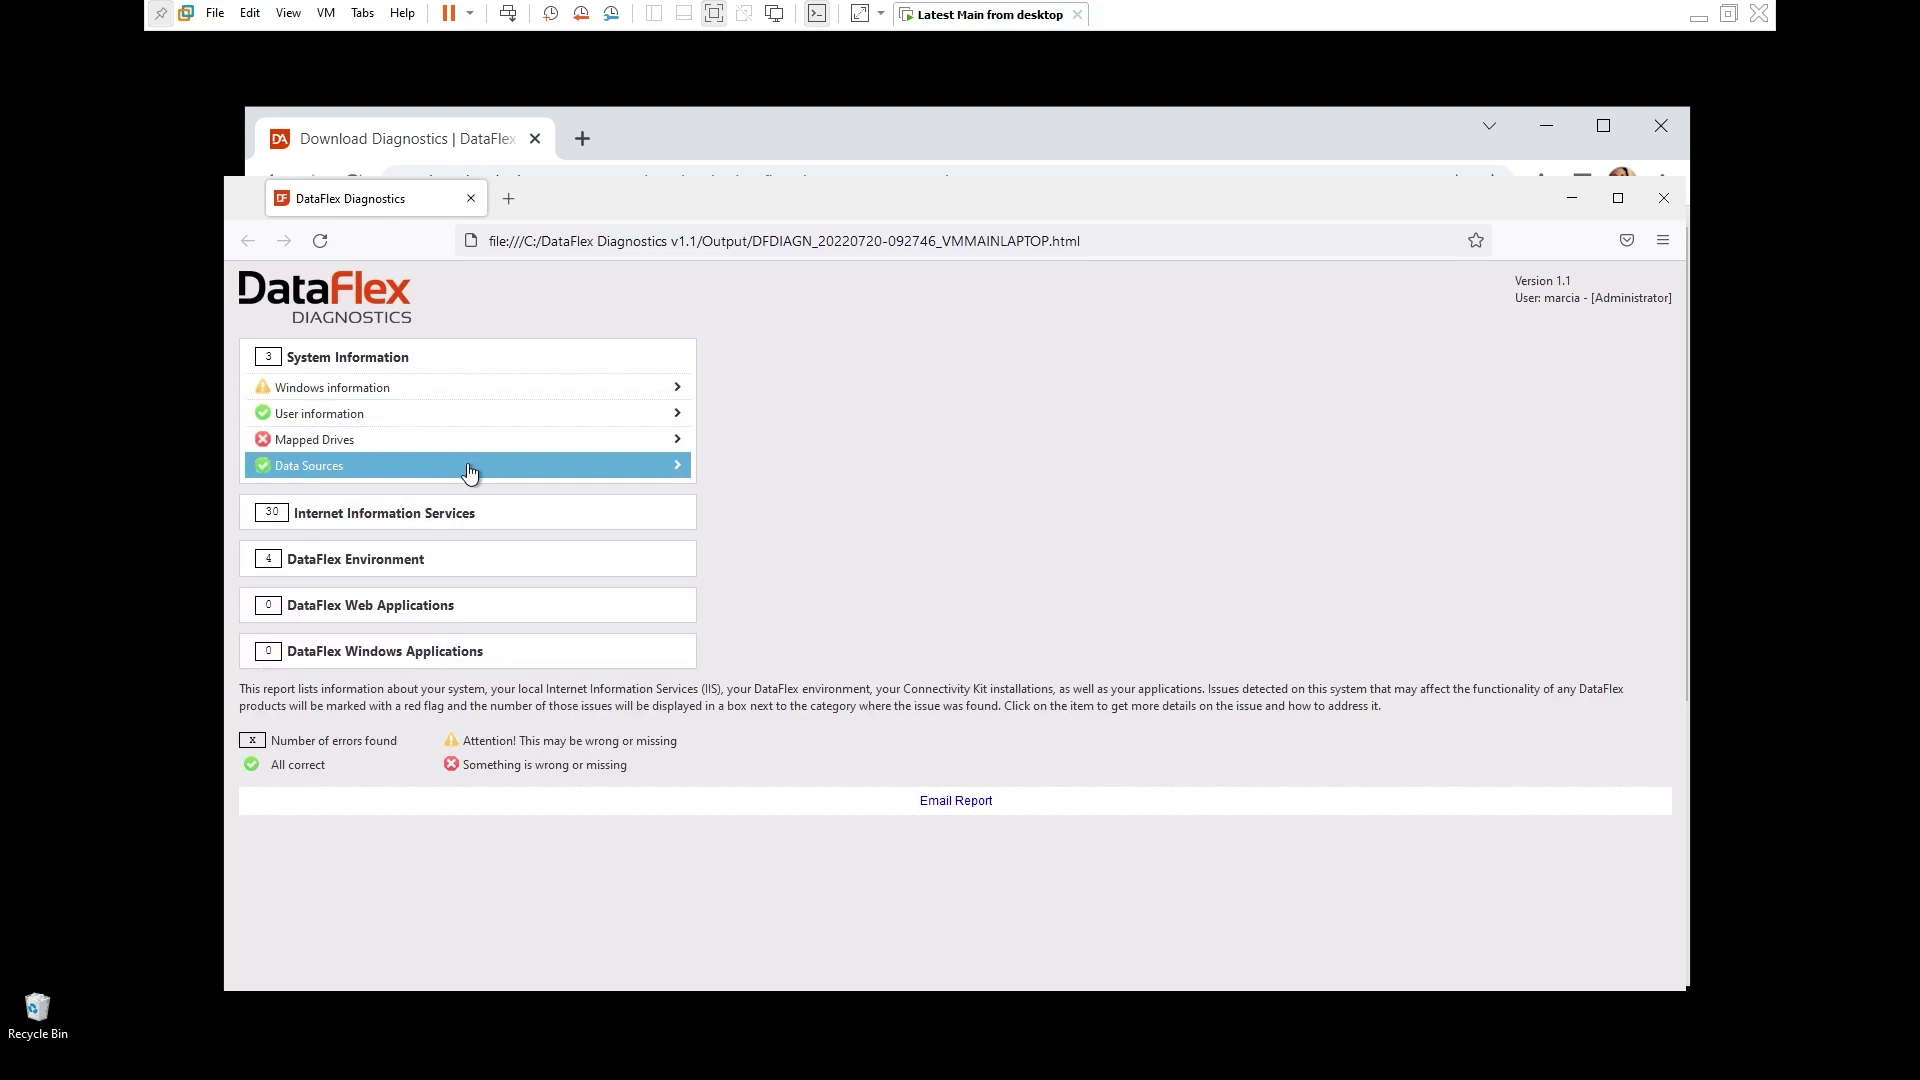
- So let's go back to the DataFlex Diagnostics and open the report
- This is what the report looks like, it opens in the browser because it is an HTML file
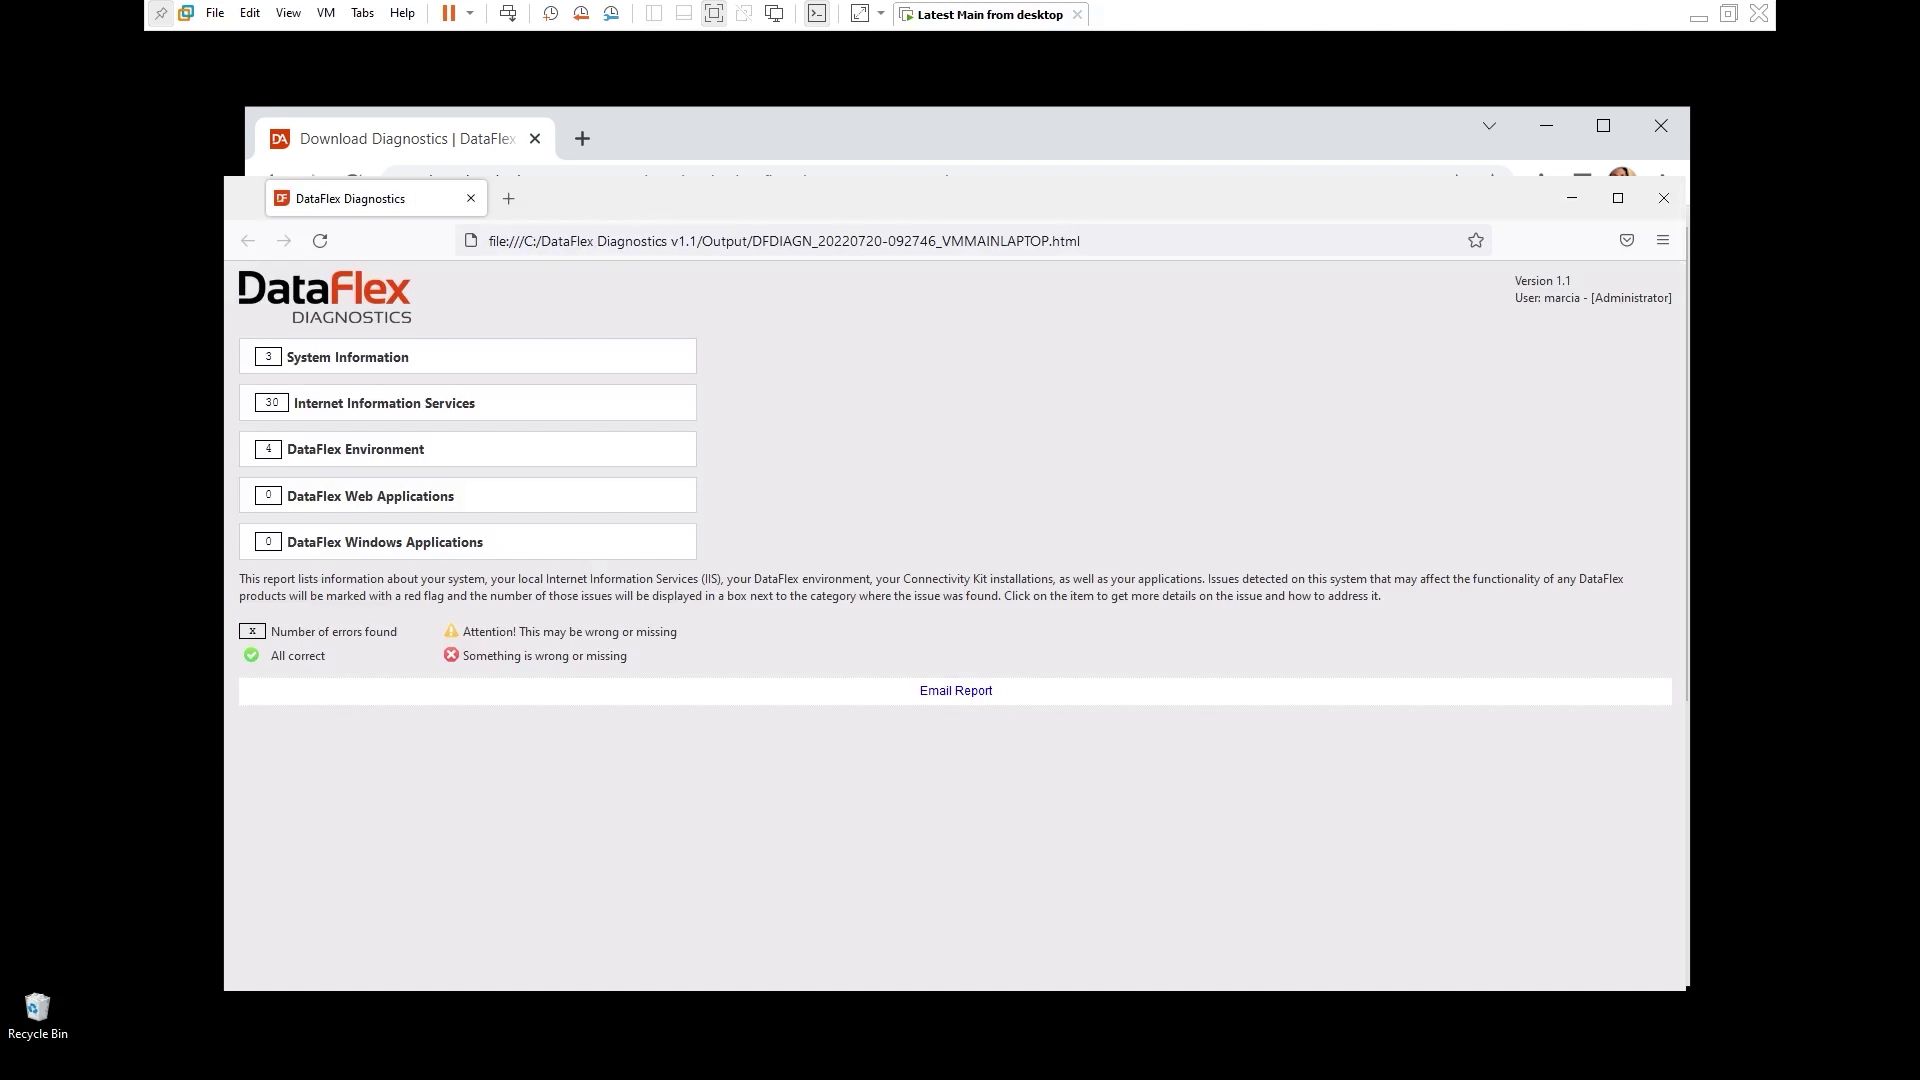
- It shows the categories of the analysis
- And you see a reminder of what the symbols mean. So if it's all correct, you get a checkmark. If something is wrong or missing, you will see the x and if something needs your attention, it will be this inflammation mark
- The number in each category is the number of issues that might exist. The report is interactive. So you can click and open up the report and see all that is, is being analyzed