DataFlex - Studio Tour
Lesson 3: Workspace dashboard
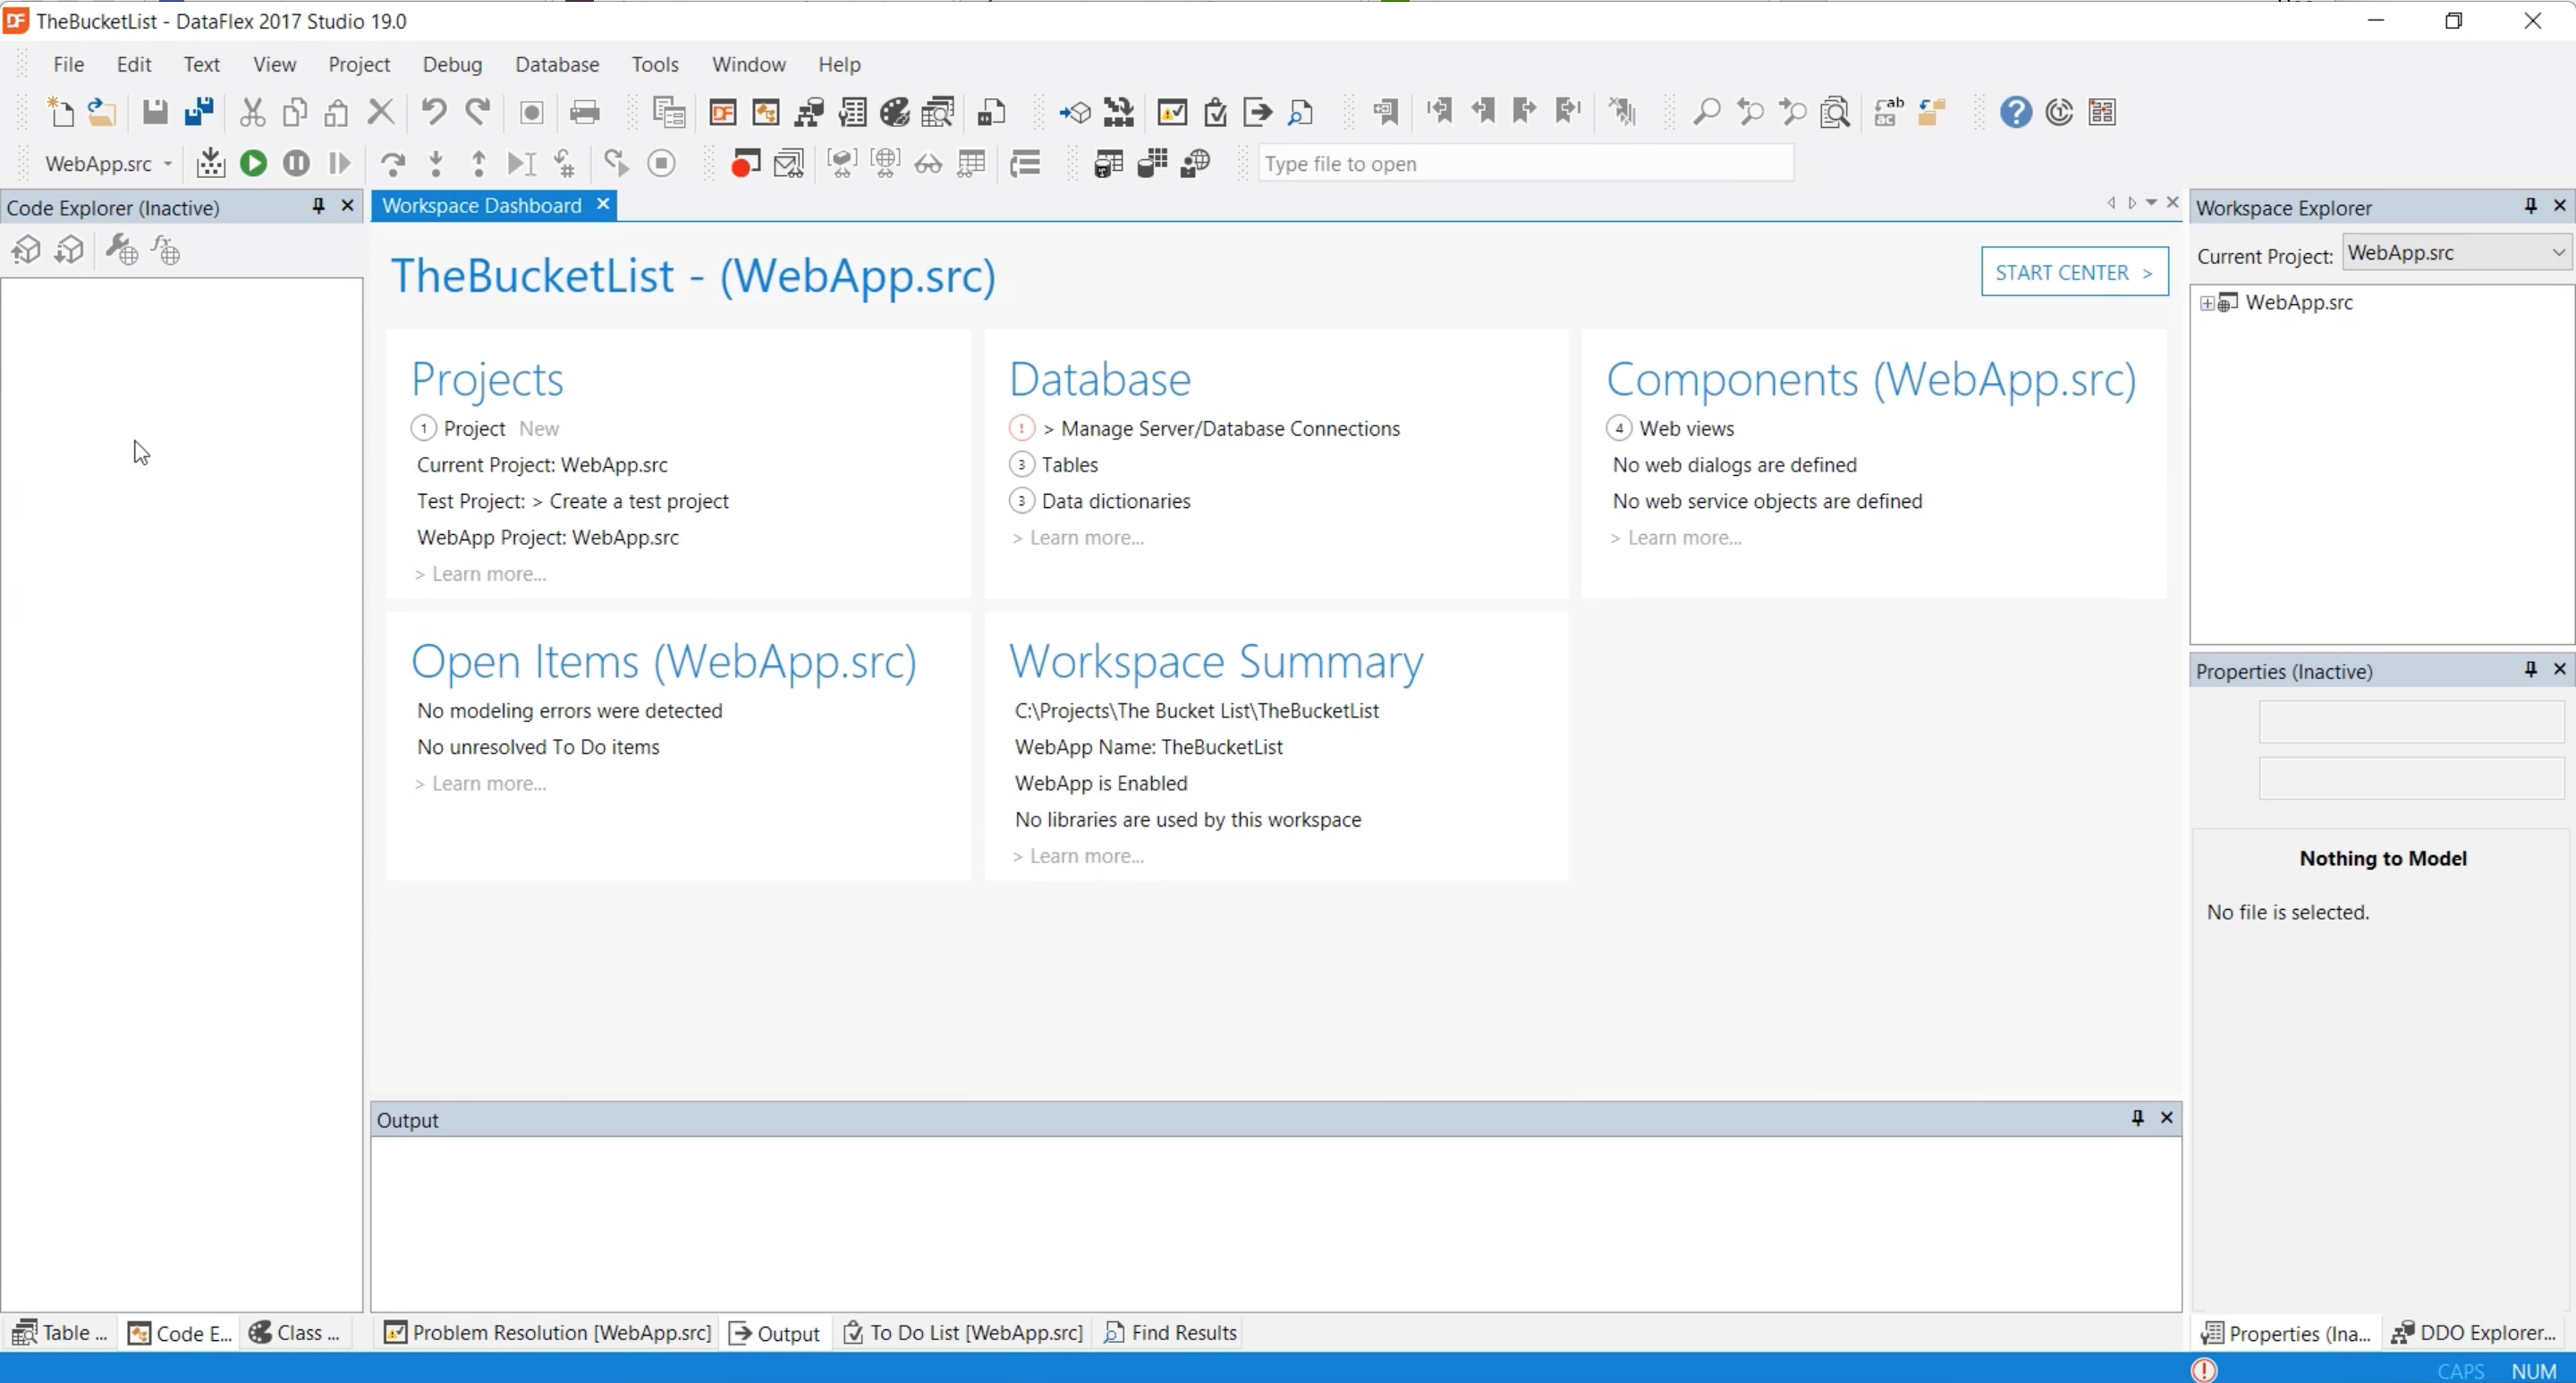
The first thing you see is the workspace dashboard. The dashboard provides you a lot of information about the workspace that you have just opened.
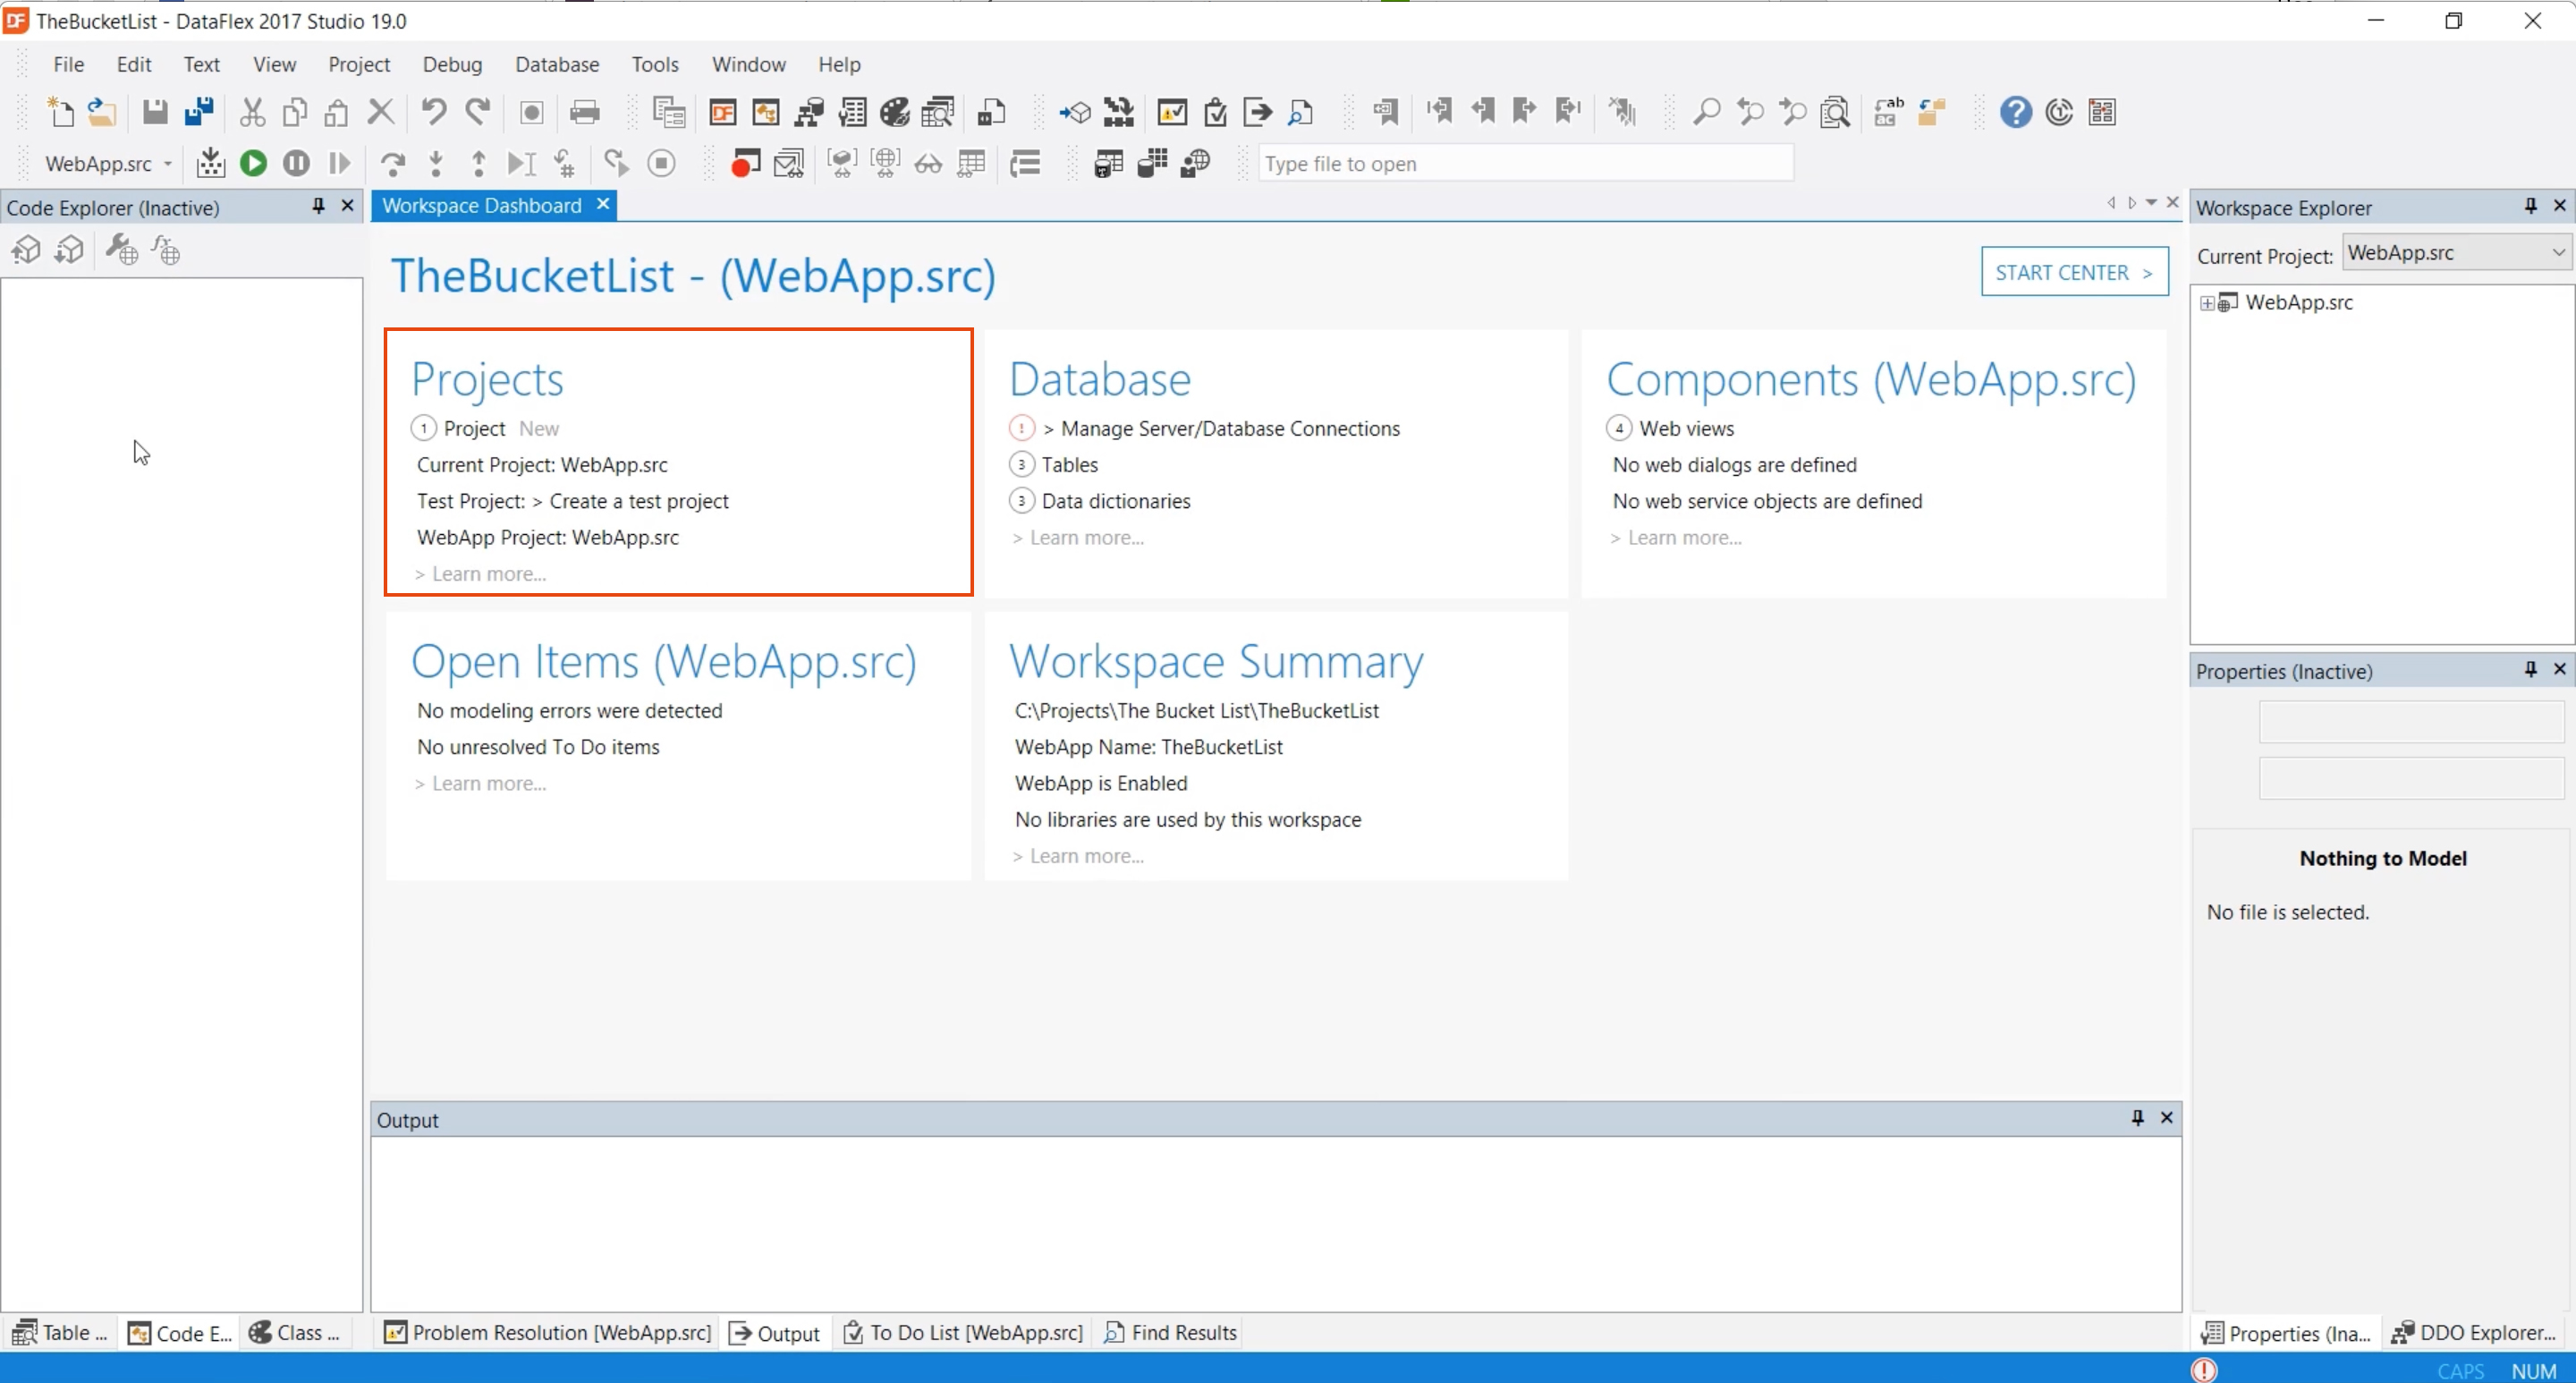
- On the left you see the projects and in this case our workspace has one project. The current project is the ‘WebApp.src’ project. A workspace can have multiple projects which will result in a higher number here.
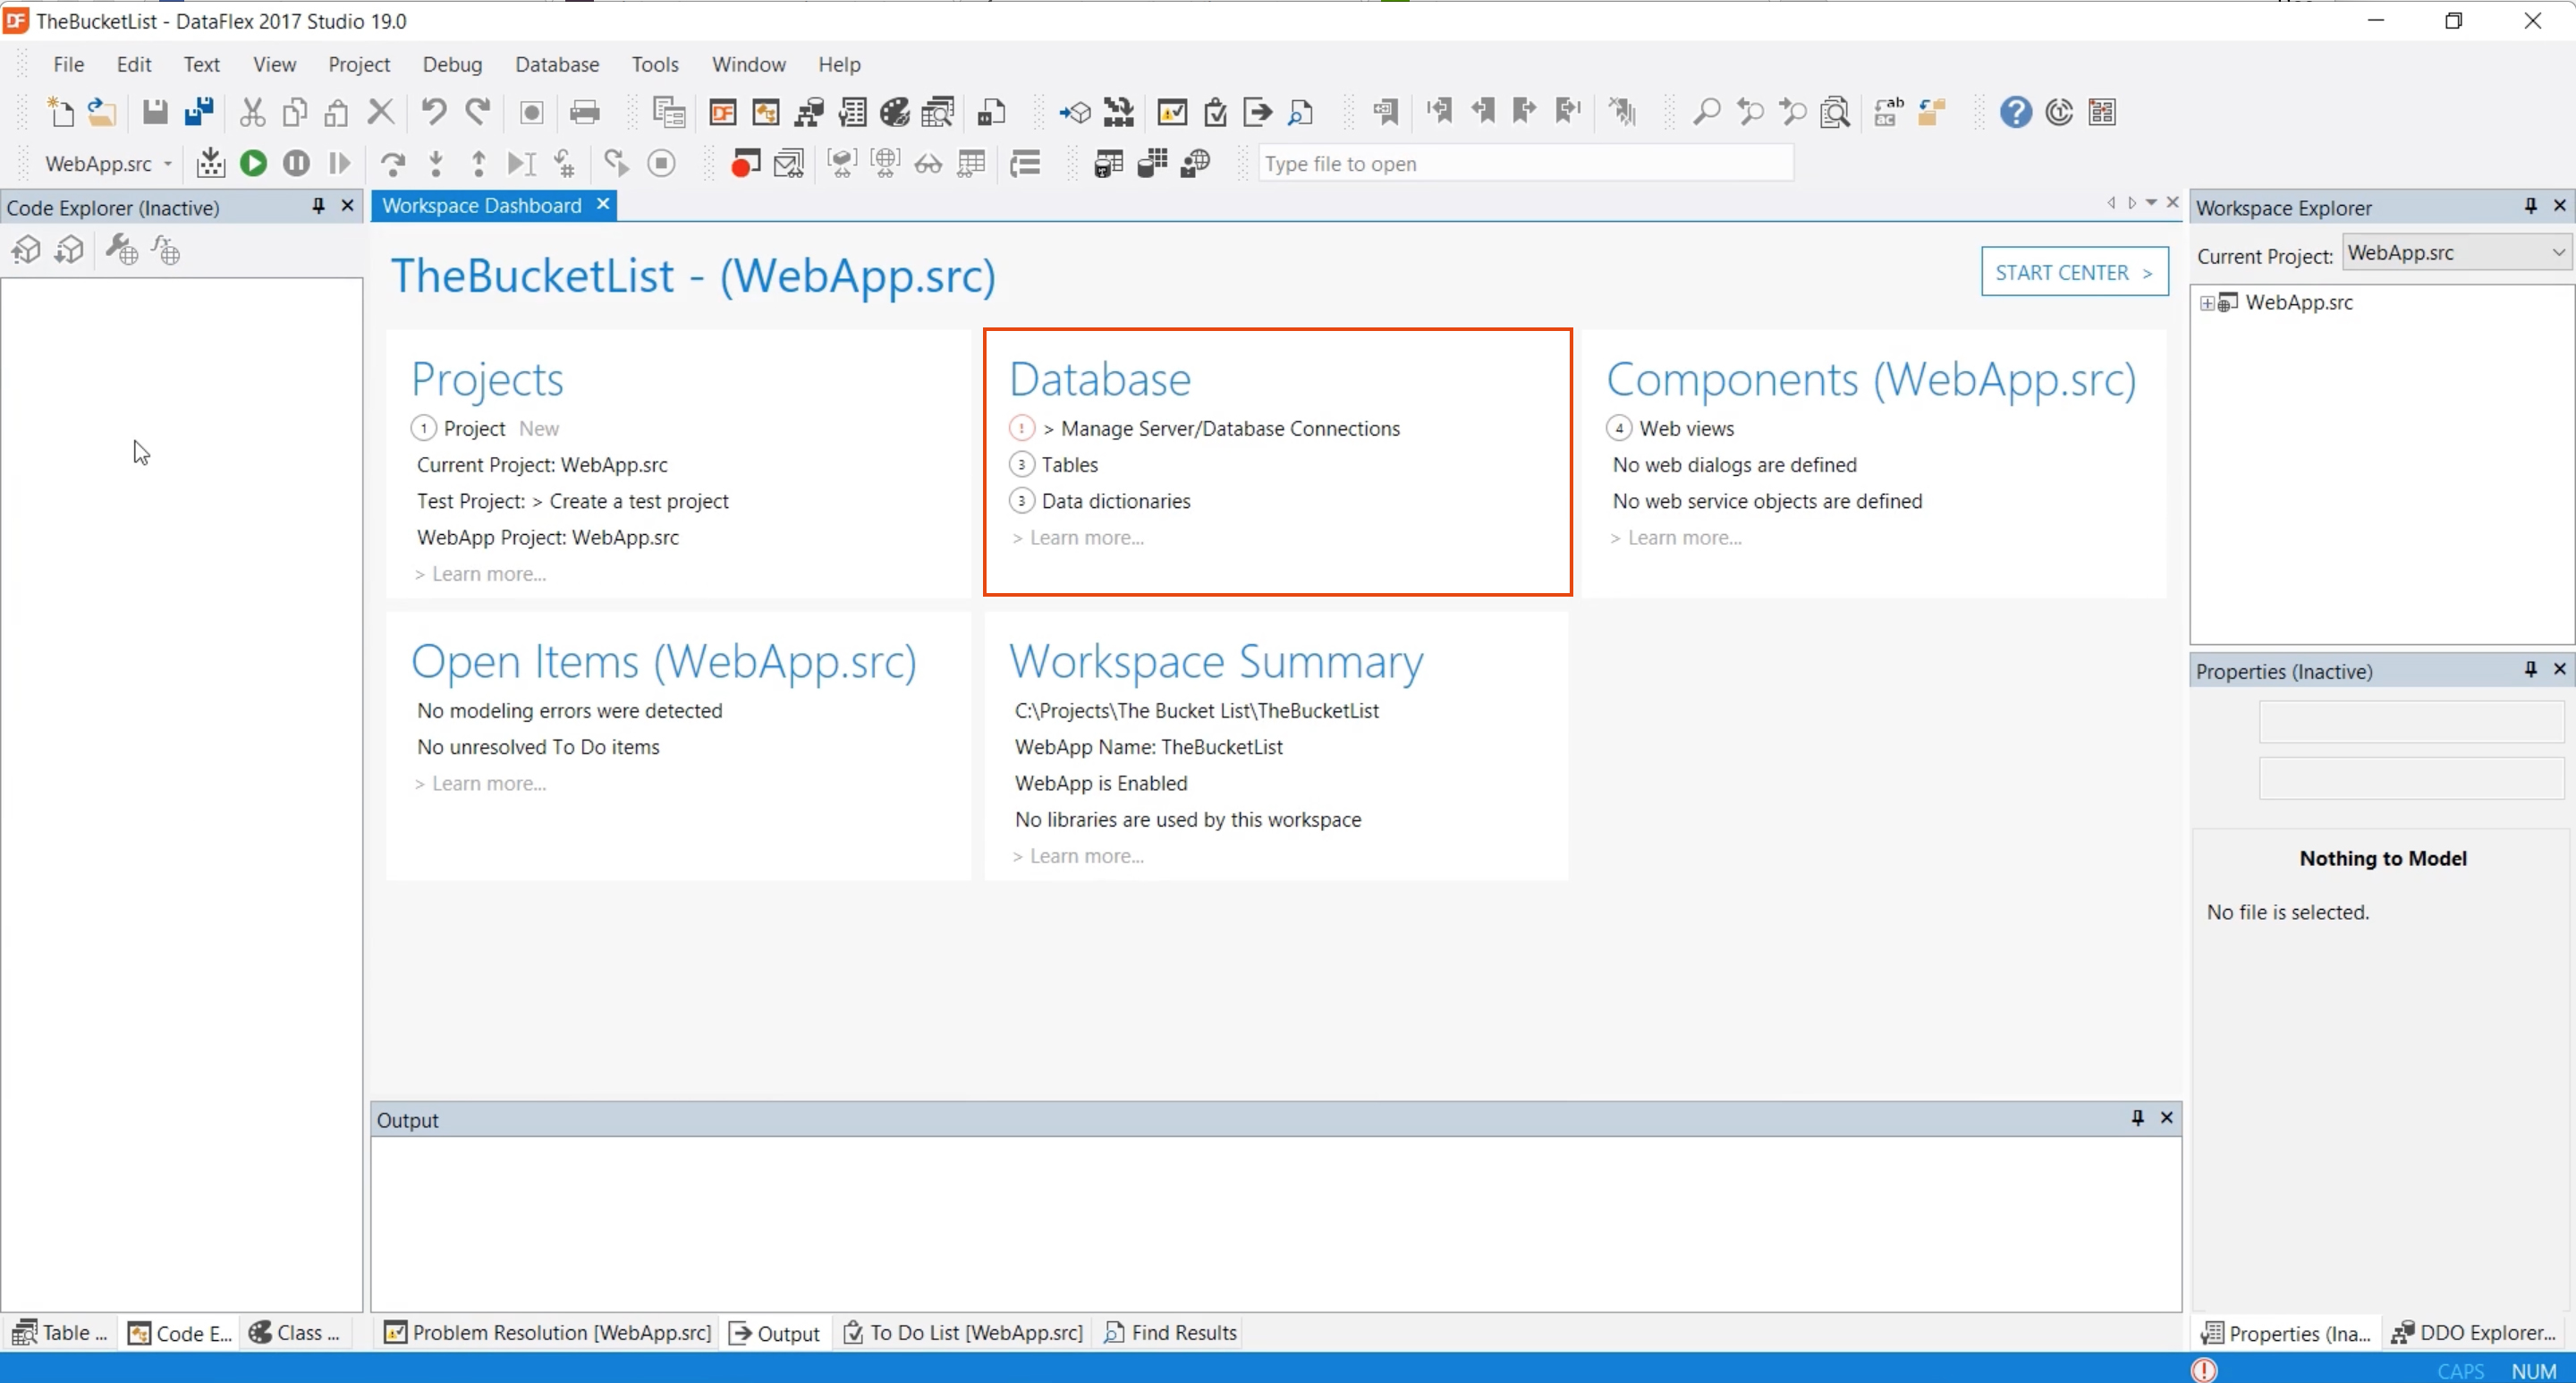
- Next is the database information, in this case we have three different tables and three different data dictionaries. You can also have managed connections here that are the connections to a SQL databases.
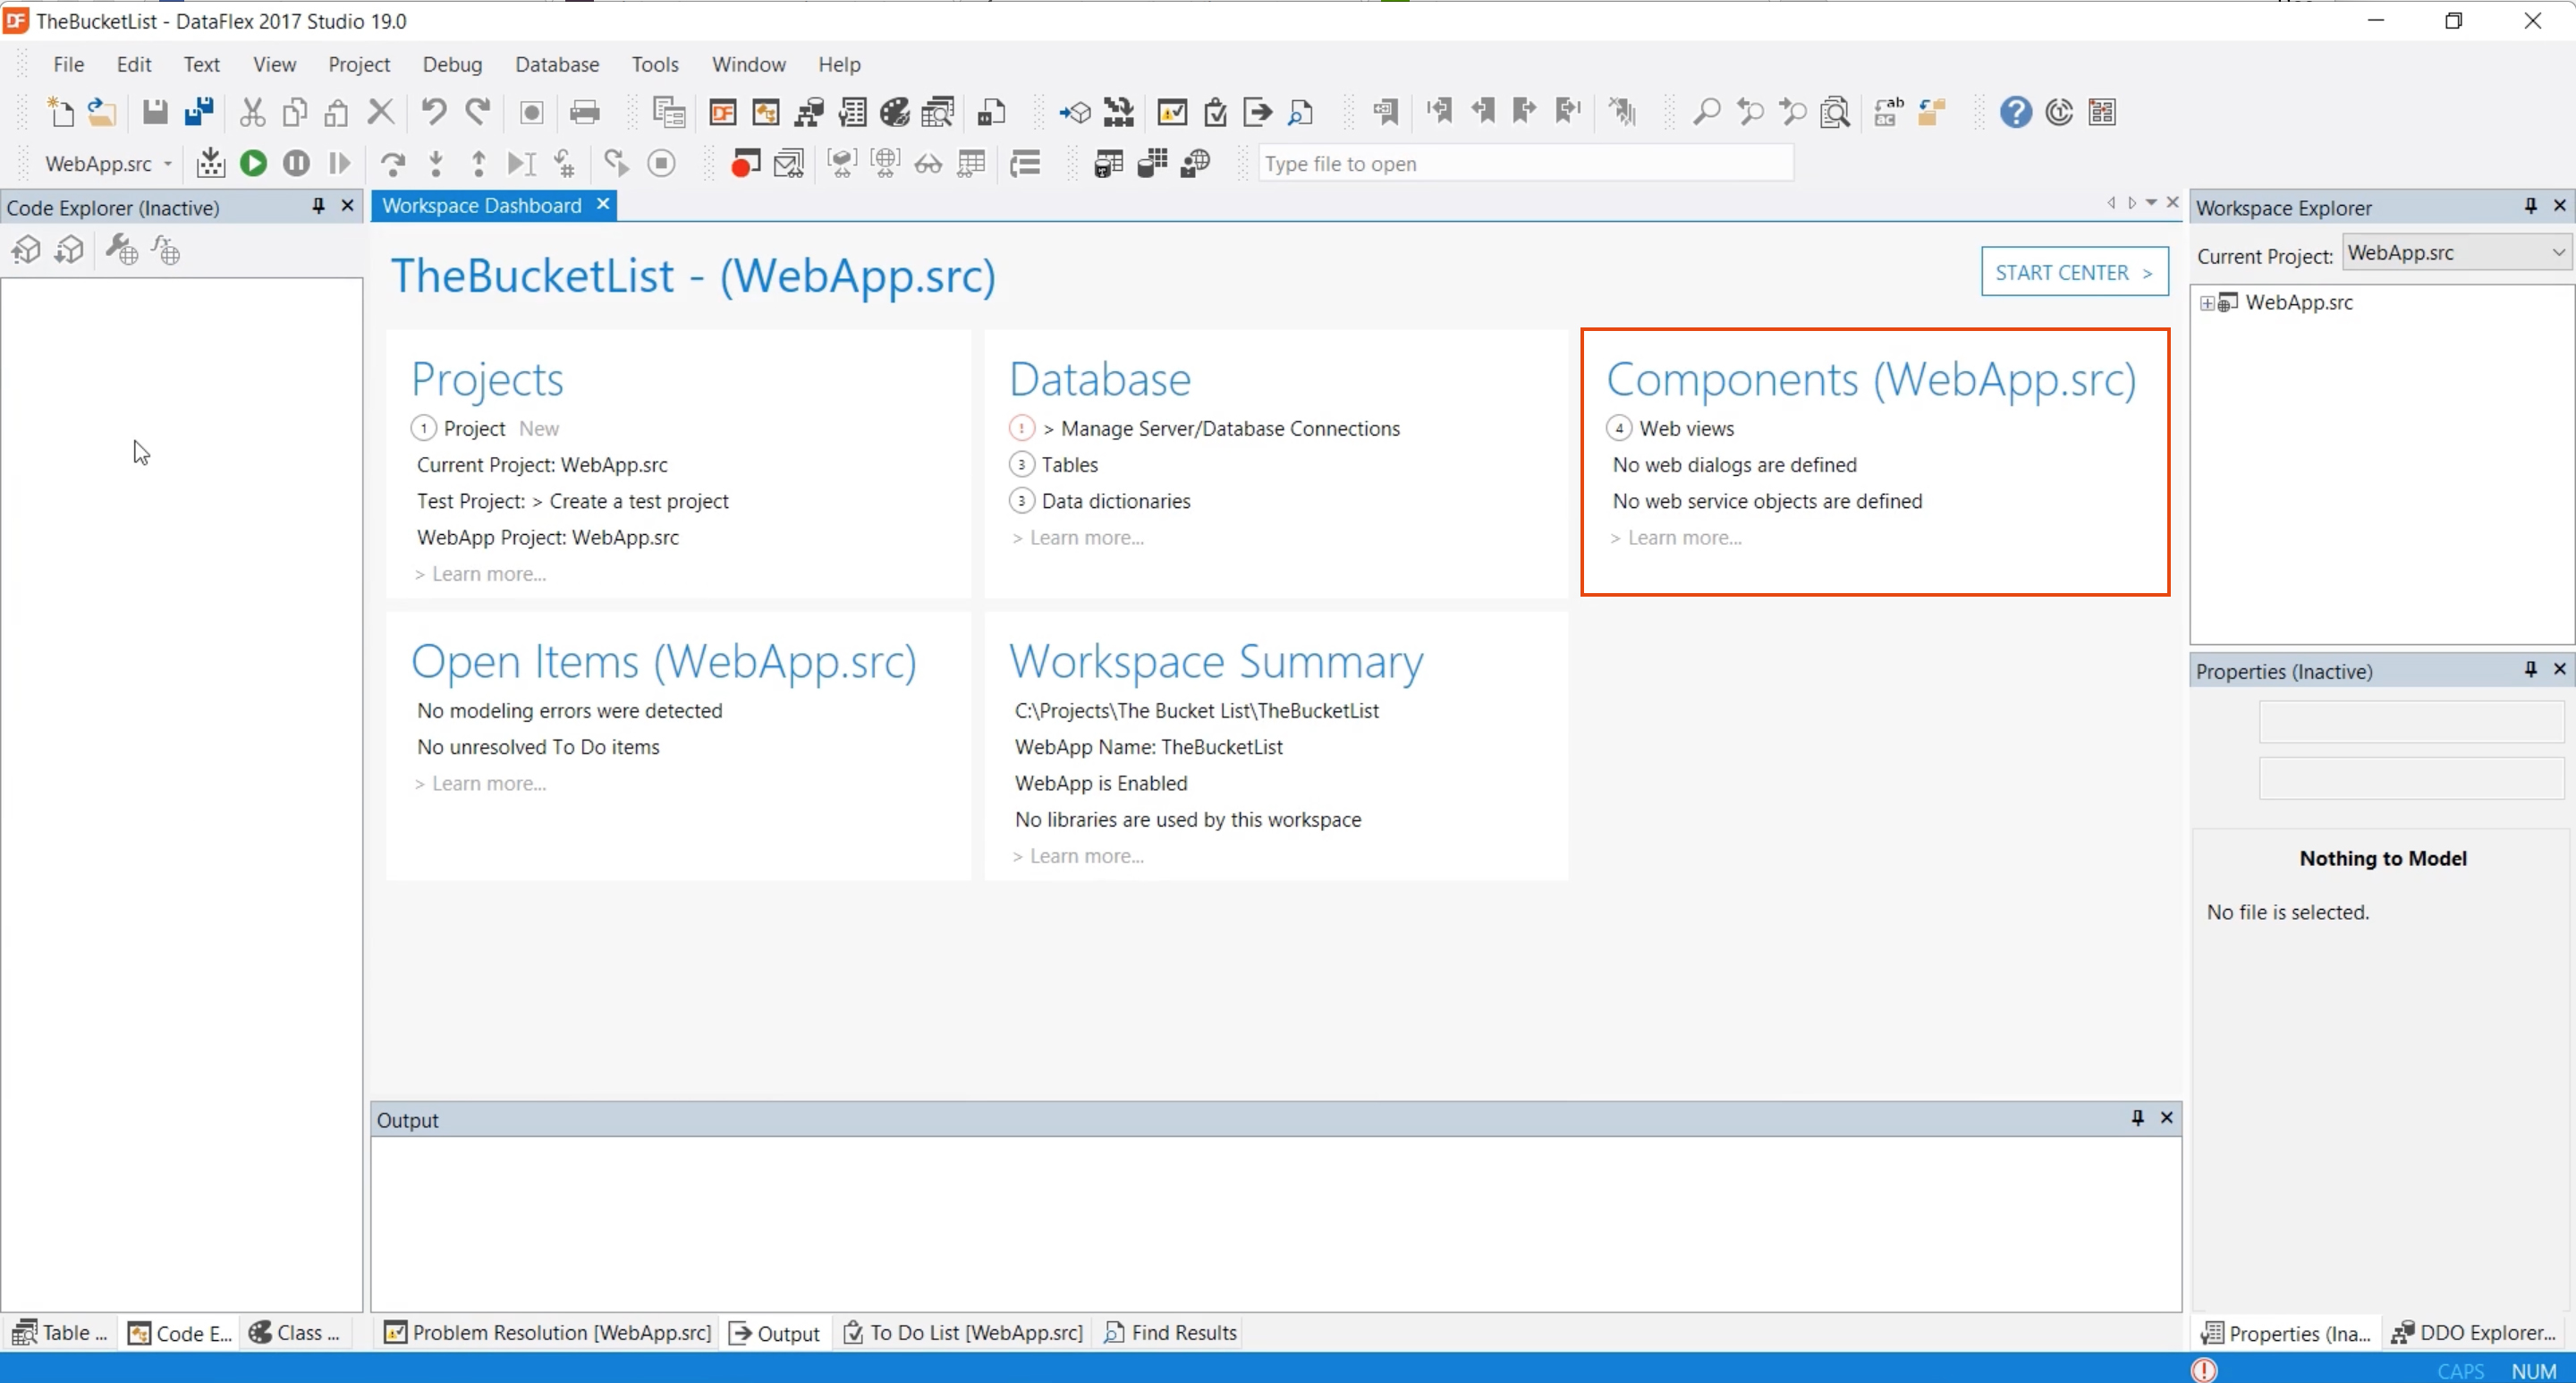
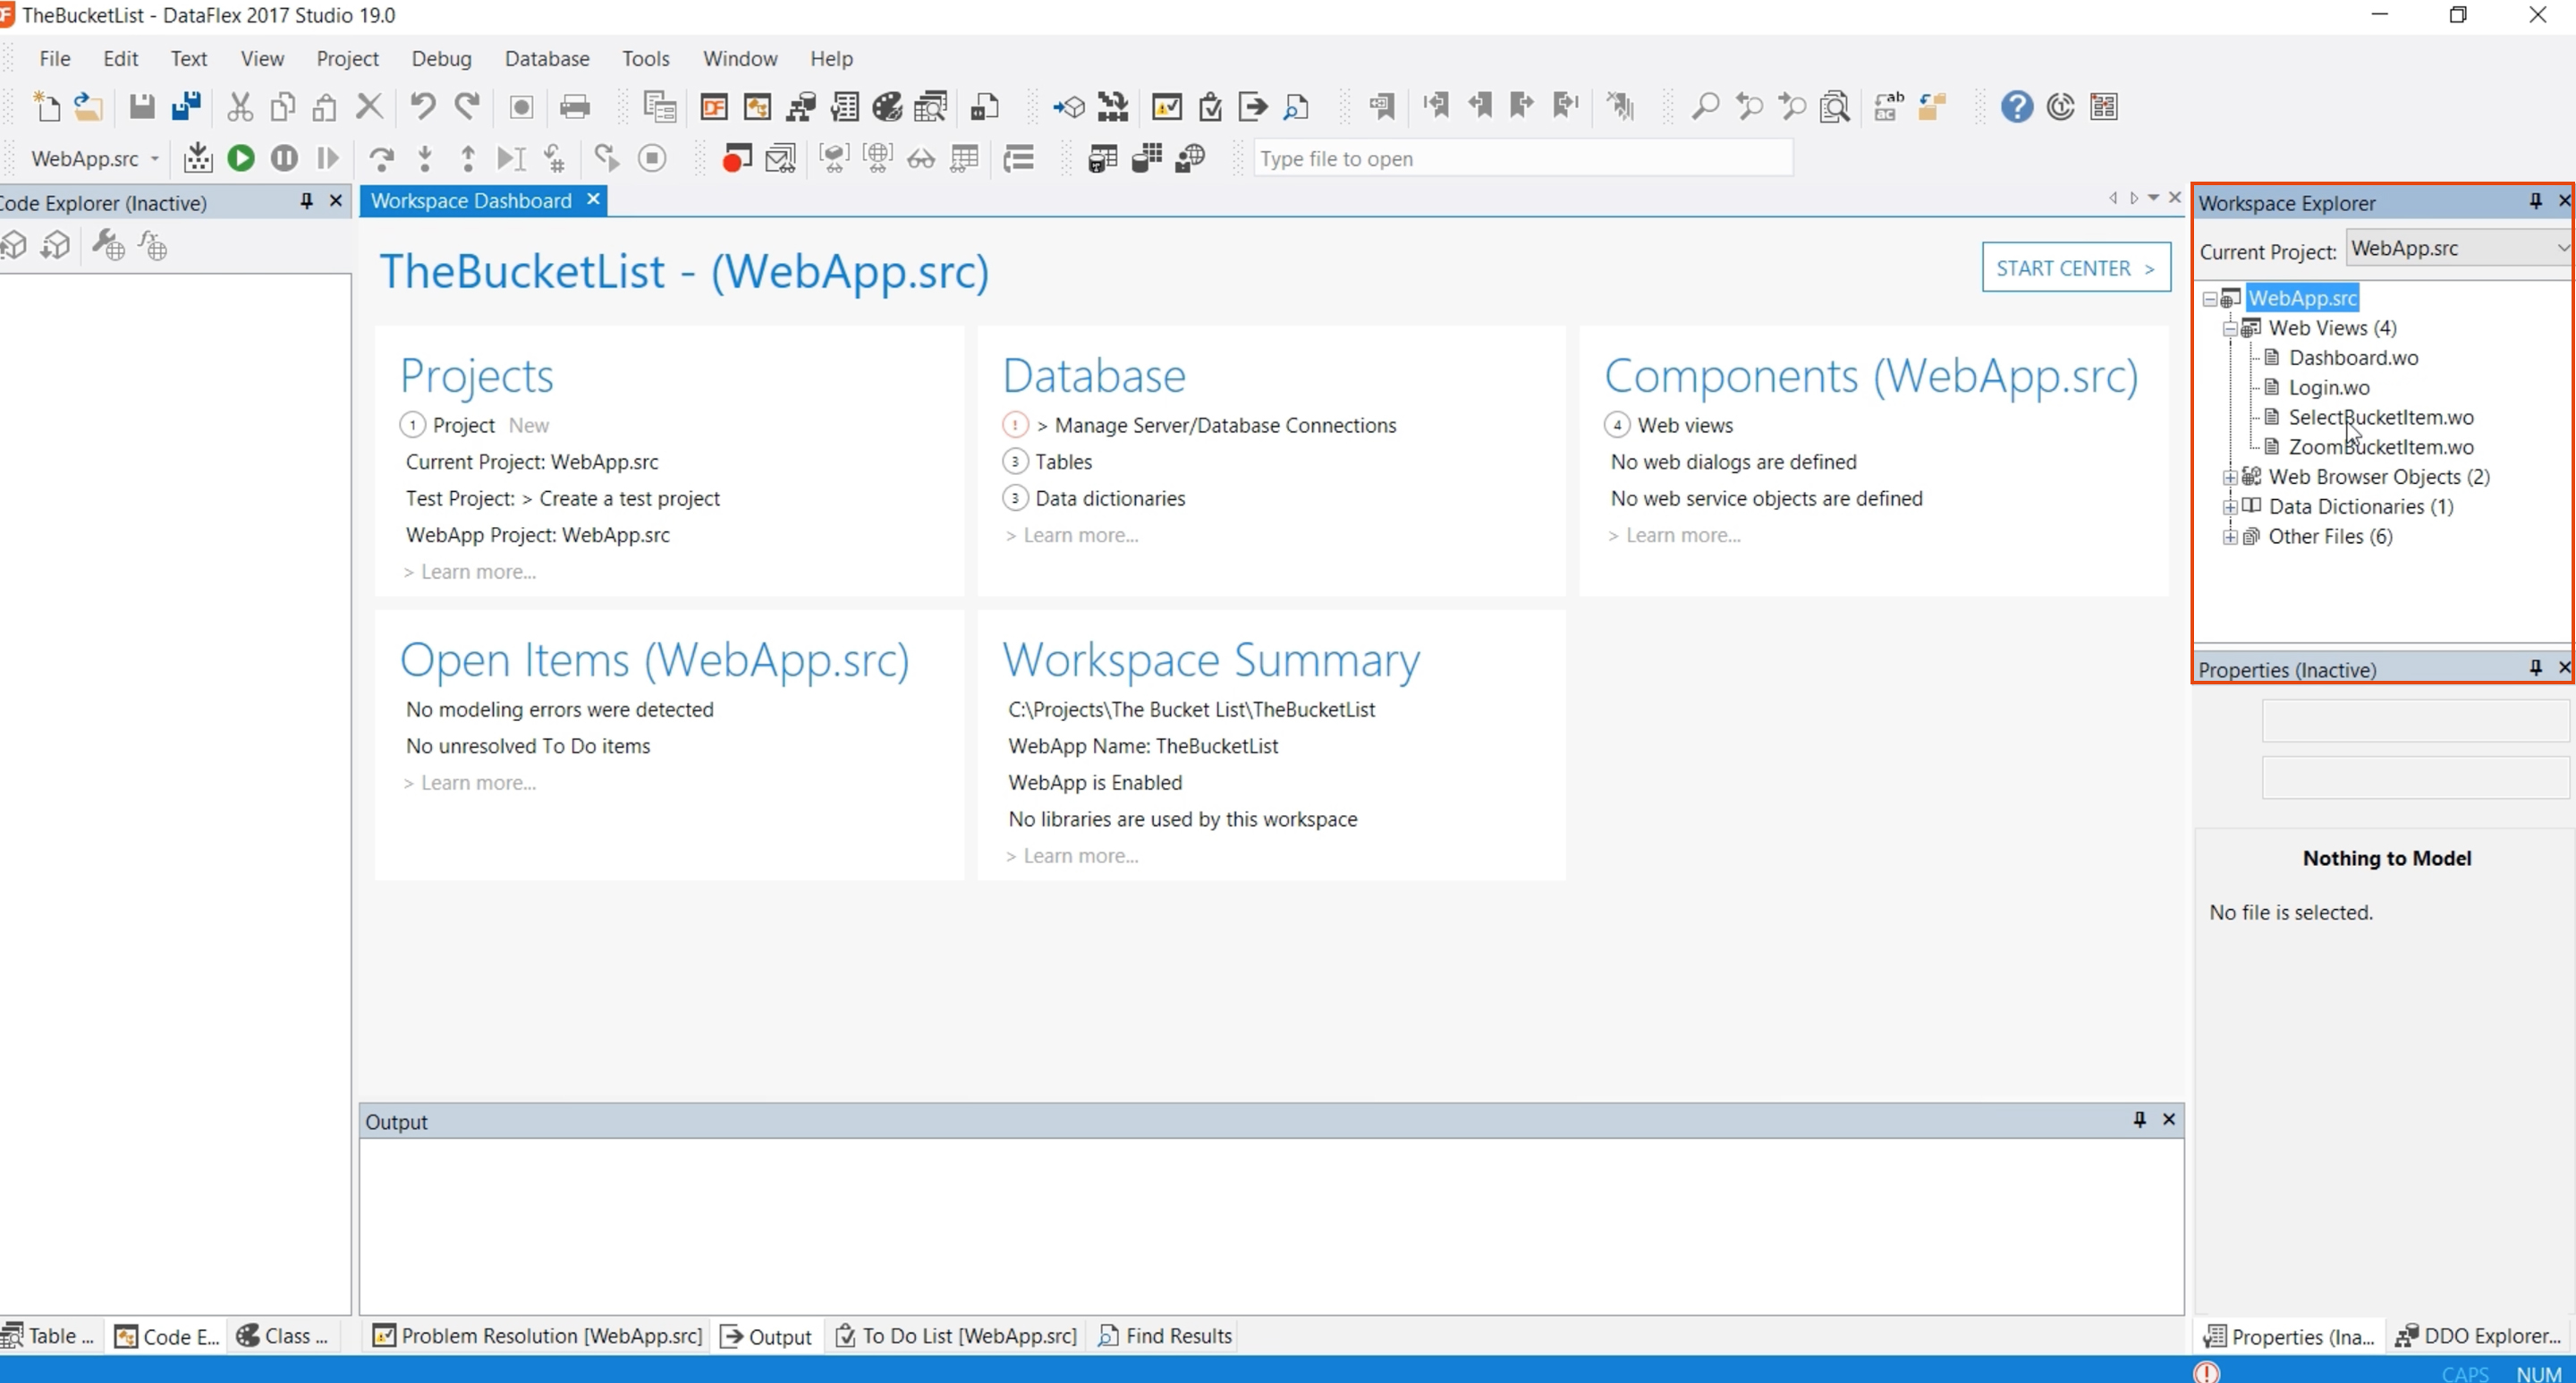
- The components, in this case, show that we have four different views in this workspace.
- To see what views you have, use the workspace explorer. It shows the different projects and if you expand one of the projects, you can see the different views, 4 in this case. These are the files that are a part of the workspace.
- The open items tab shows the to do items.
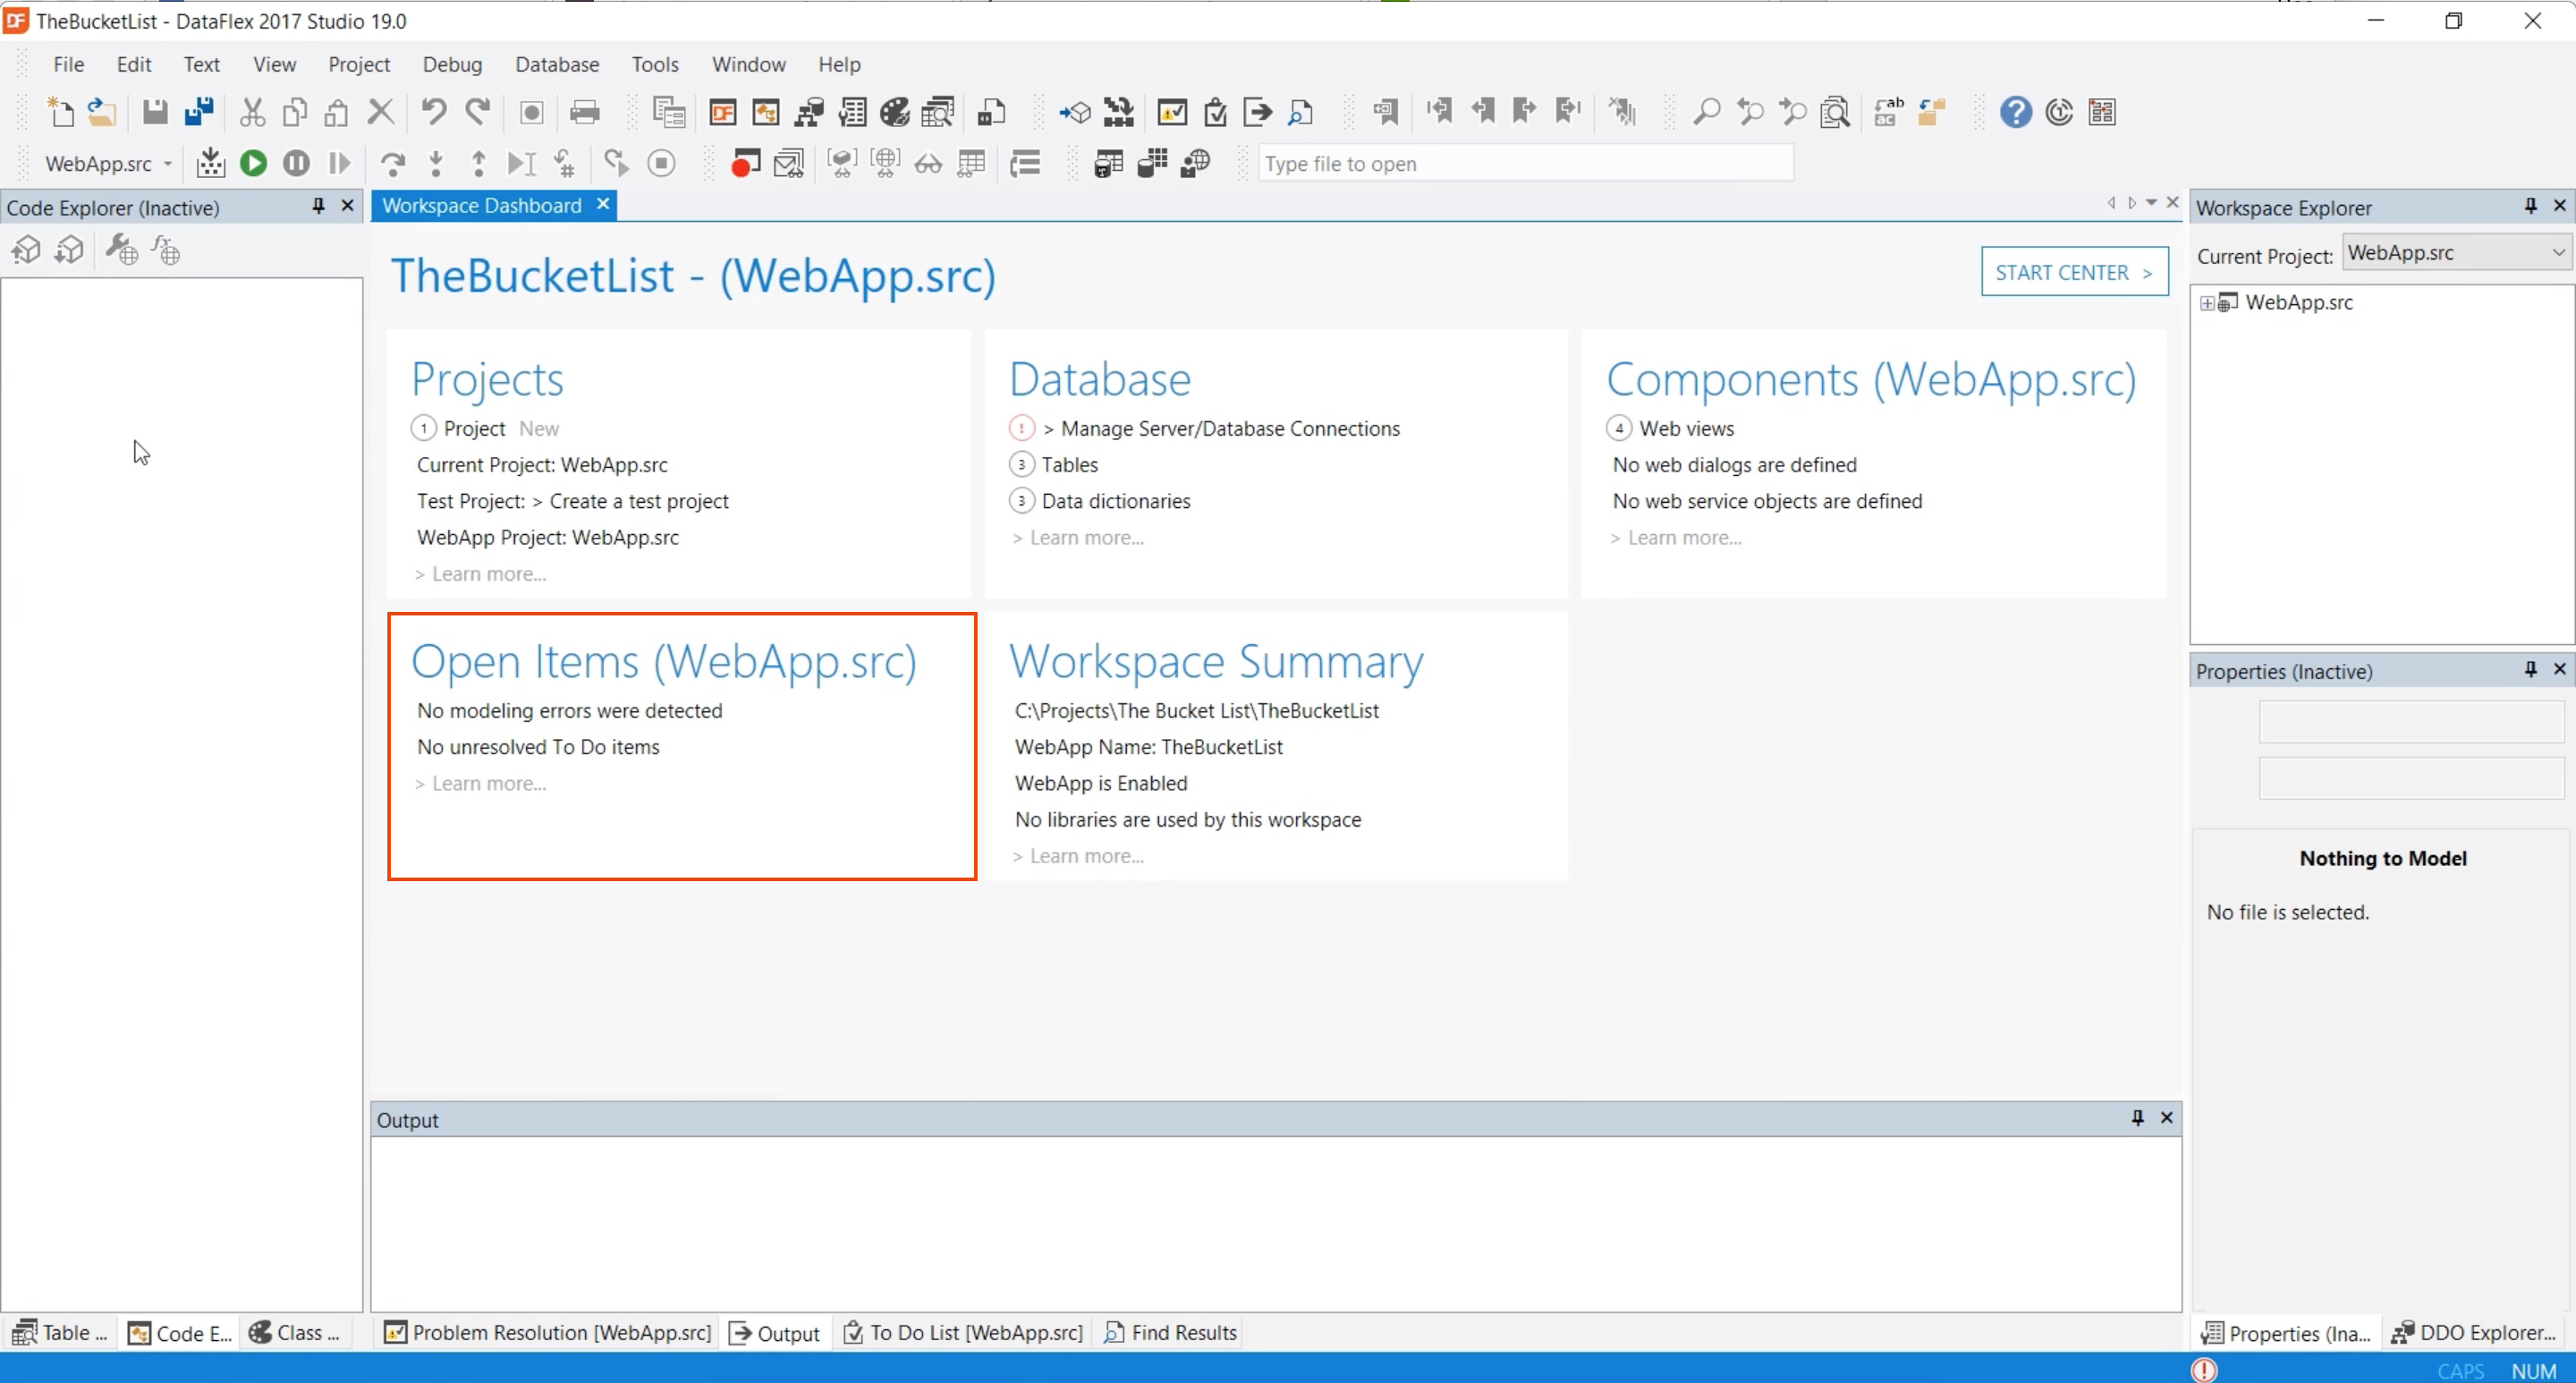
- The workspace summary shows information about how the workspace is registered and where it is located on the hard drive. In this case we see that the web application name is ‘TheBucketList’. That is the name that the web app server knows this workspace by.


