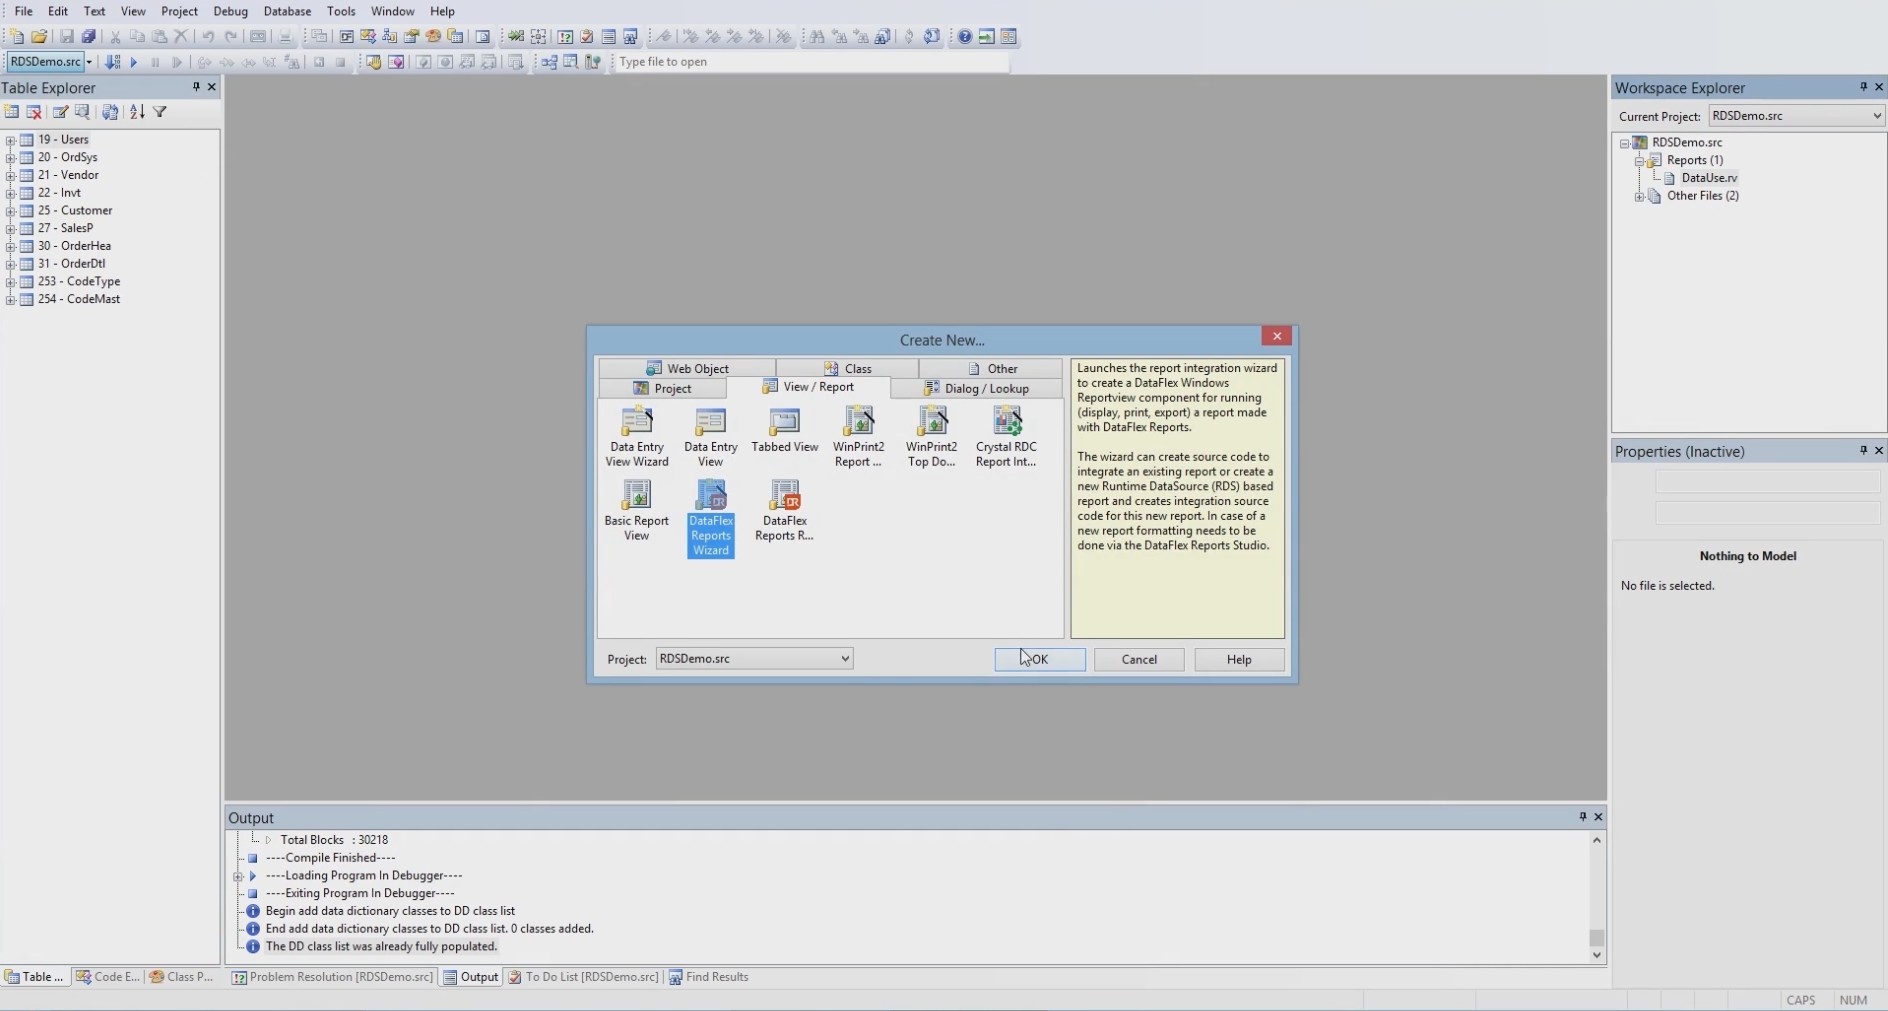
To start the new wizard select ‘Create new..’ and choose the ‘DataFlex Reports wizard’ option.
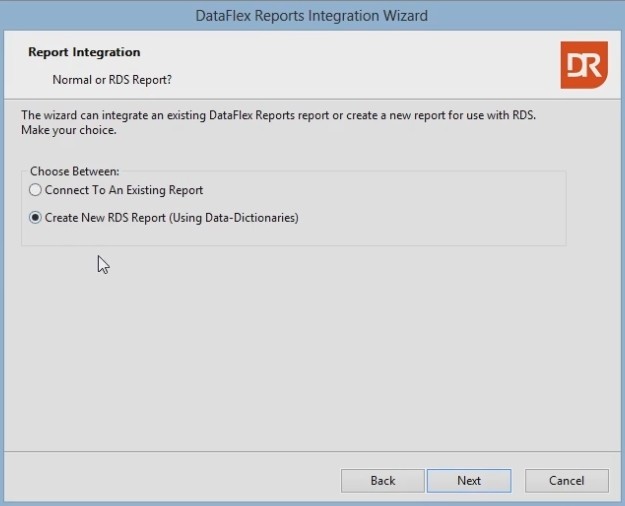
Press next and select the ‘Create New RDS Report (Using Data-Dictionaries) option.
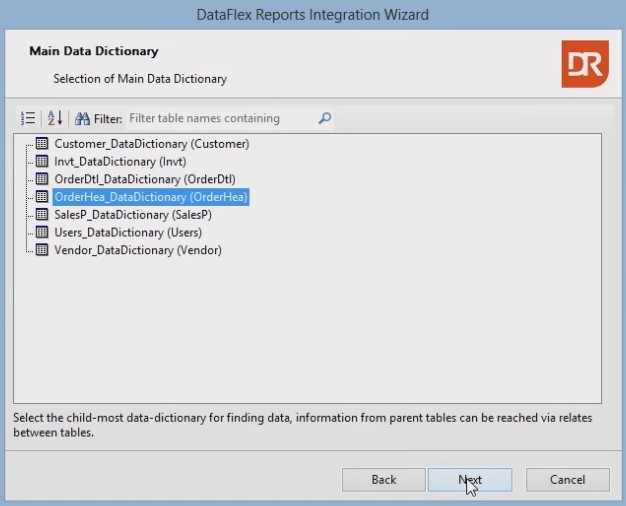
The next window shows a list of all data dictionaries for the current workspace.
The toolbar above the list, let’s you sort the data dictionaries by number, or to search for a specific table.
Select the ‘OrderHea_DataDictionary(OrderHea)’ and go to the next window.
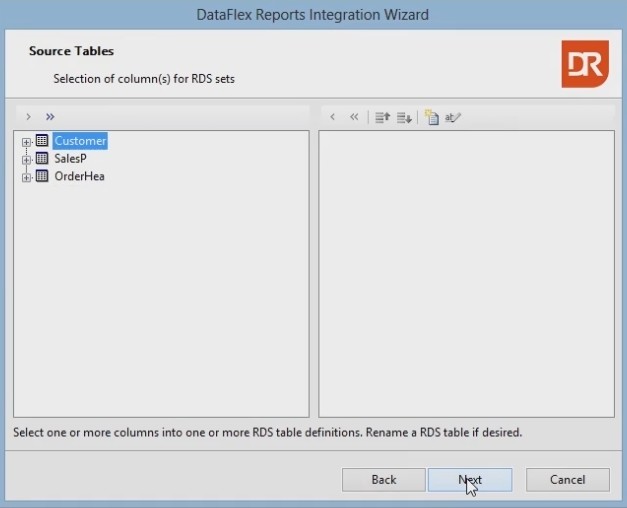
The order header table relates to a customer and a salesperson table. The source table page will therefor automatically show three tables instead of only the selected order header table.
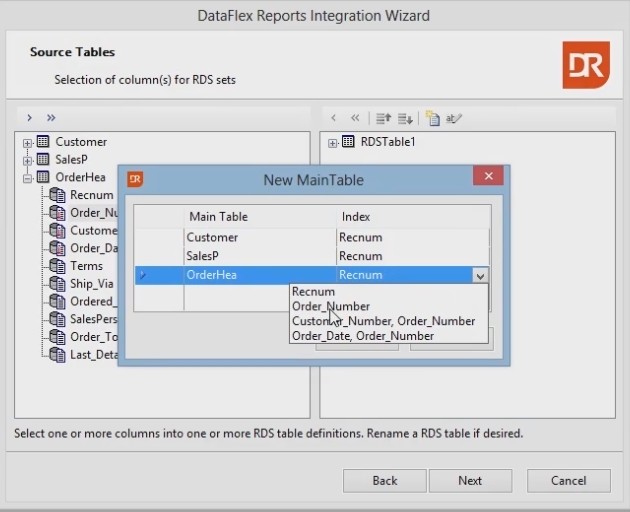
Select the source column’s with the data that has to go into the RDS Array. Selecting the first column pops up a dialog where you need to pick a table to collect the data from. Click the ‘Order_Number’, you’ll notice that the ‘OrderHea’ is pre-selected.
In the column labelled index, select the correct index, in this case ‘Order_Number’.
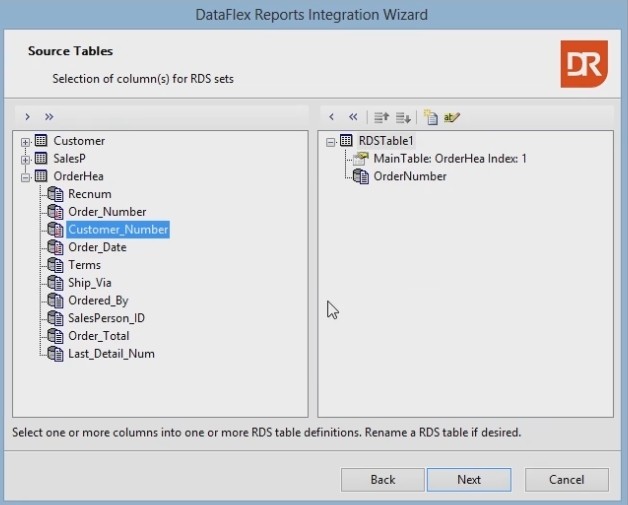
As a result, the list on the right now shows the name of the RDS table, the selected table index and column.
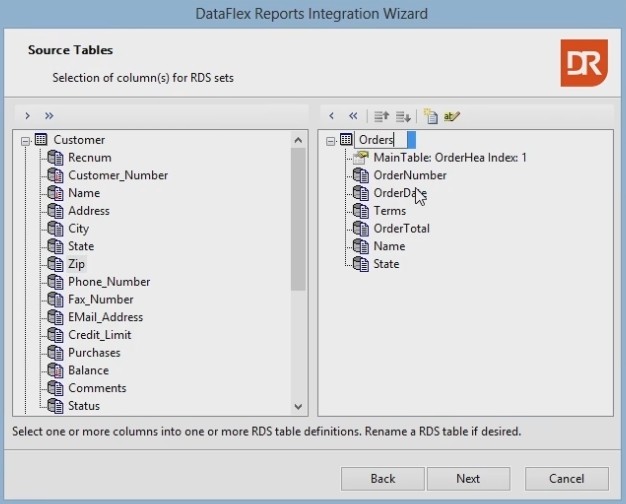
Add some more colums from the order header and customer table, finally rename the ‘RDSTable1’ to ‘Orders'.
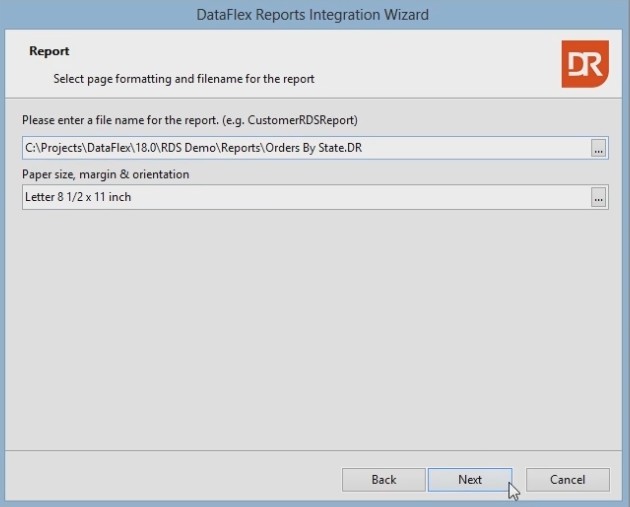
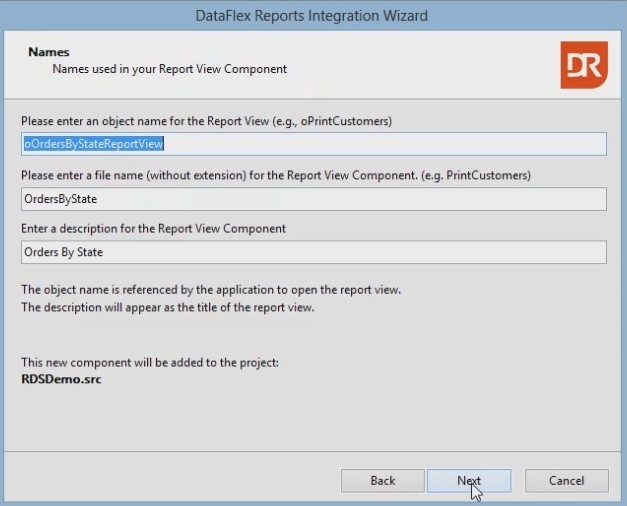
In the next window, specify the file name, location and select a page setup.
Accept the default options in the Name Fields window.
Skip the part that would allow end users to make selections. You can do that later by writing DataFlex source code.
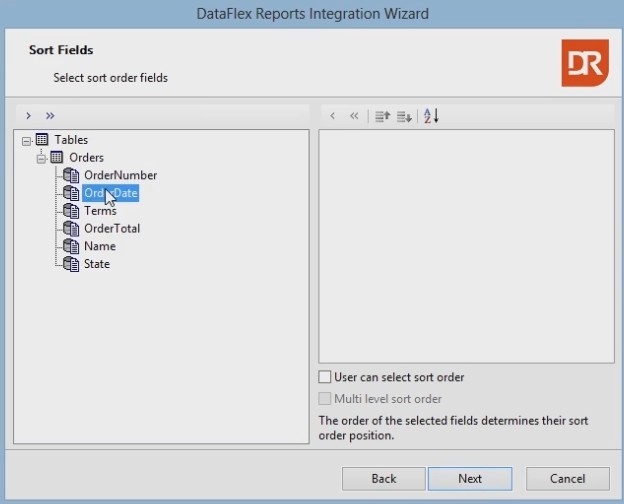
On the ‘Sort Fields’ page, select the sort ‘OrderDate’ option, we won’t allow end users to make any changes.
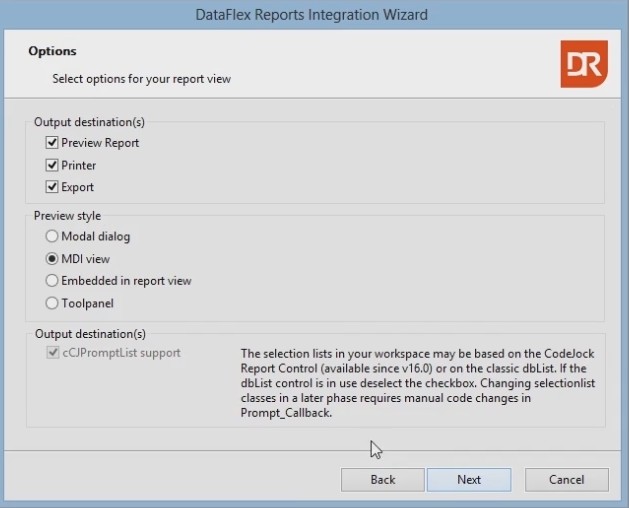
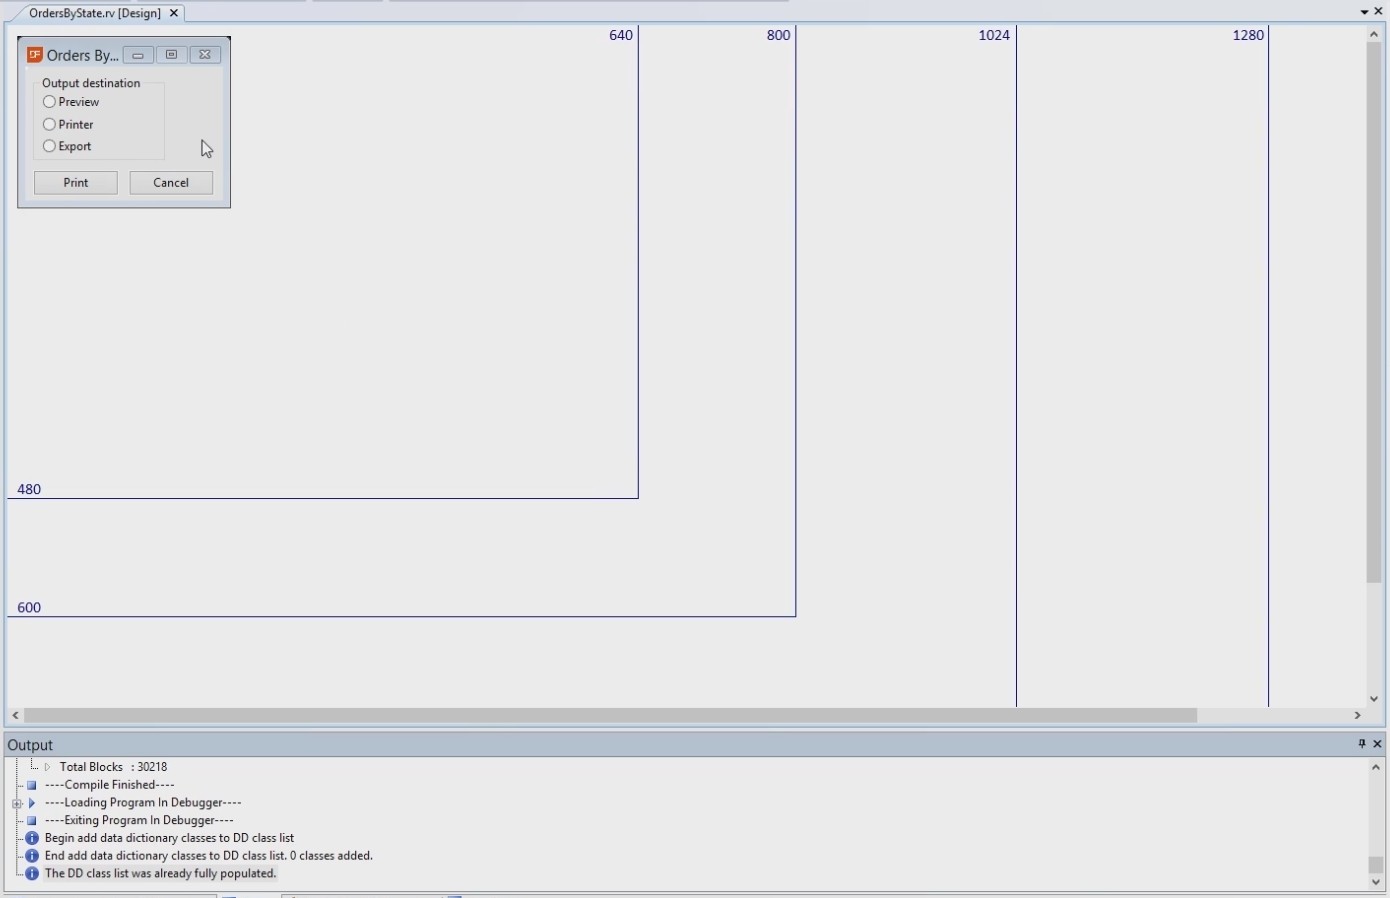
The options page lets you define which output destinations should be available and where to show the preview.
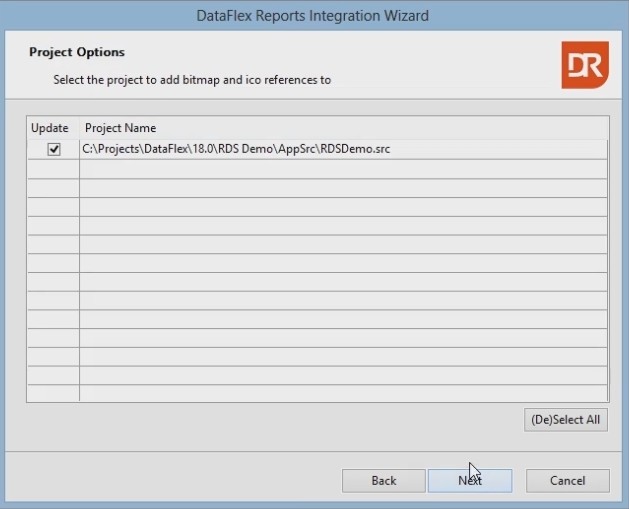
The project options page is for specifying which projects images need to be embedded for use in toolbars. Finally click next to complete the wizard.
The result is loaded in the studio.
Switch to source code, to see what the wizard created.
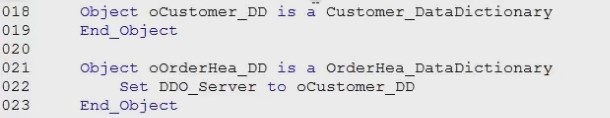
On line 18 to 23, the wizard created 2 data dictionary objects that will be used for finding data.
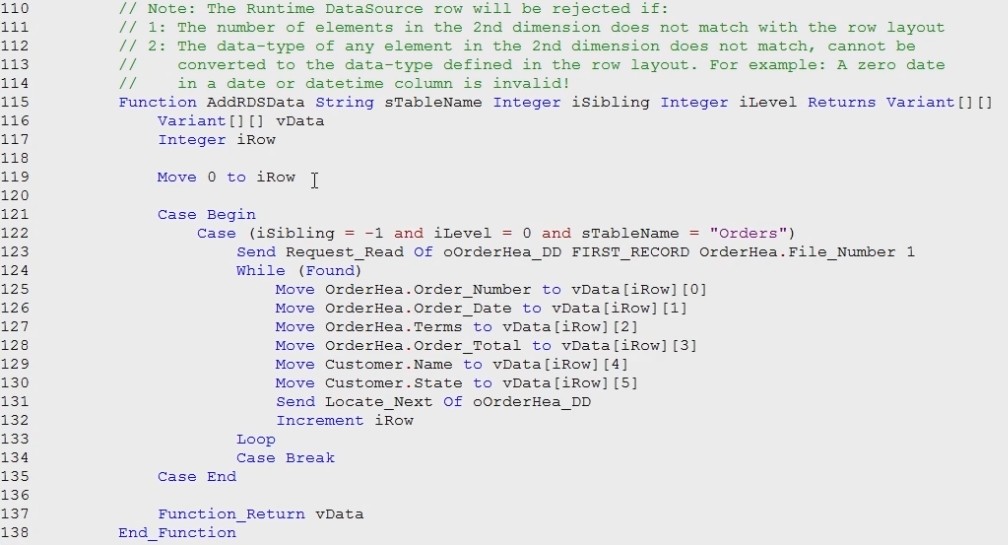
Scrolling down the code you can find the function ‘AddRDSData'.
In this function the order header data dictionary is instructed to find all order header records sorted by the first index as we told the wizard to do.
For each of the selected source columns a statement has been coded to move the data into the array. The RDS array is named vData and is a two dimensional array. Each record from the order header table will take up a row in the first dimension, and each selected column will be stored in the second.
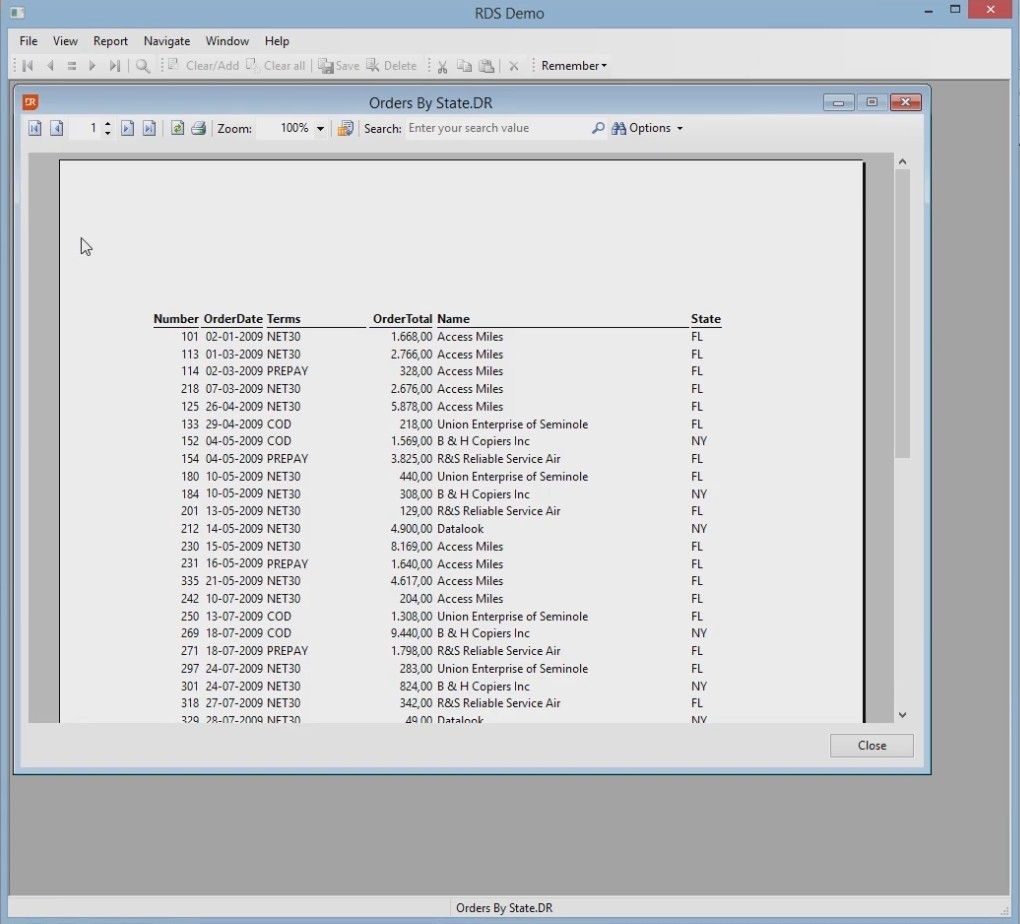
Before running the report, set up a filter in the customer data dictionary.
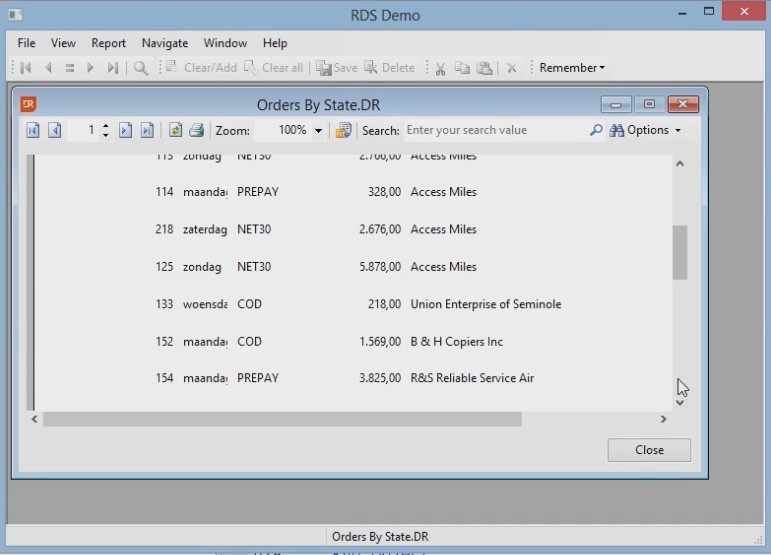
We only want to see customers from Florida and New York. Compile the application and view the results in the integrated RDS report.
The layout can be improved. For example, the order date shows a window long-date, while there is not enough space for a long-date.
Switch over to DataFlex Reports studio to load the report and change the layout.
After saving the changes, the report can be previewed within the application. It is not necessary to make any application changes. The report looks much better already!
Now you know how the new wizard works. It was designed so that it would take you little time to get this result.