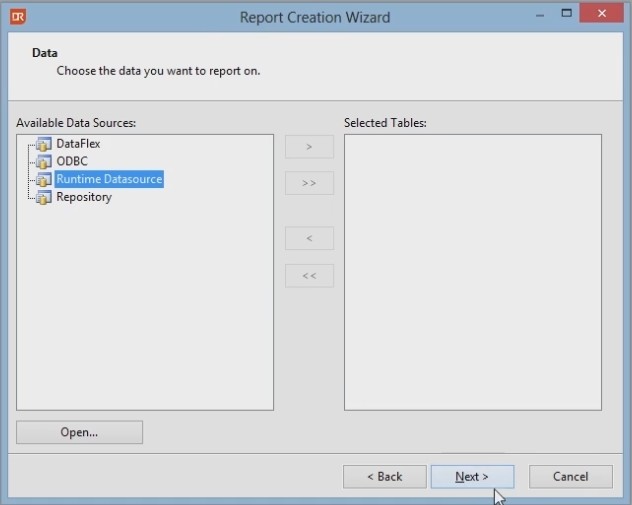
Start with designing the report with the DataFlex Reports studio, using the new report wizard and select the Runtime Data source.
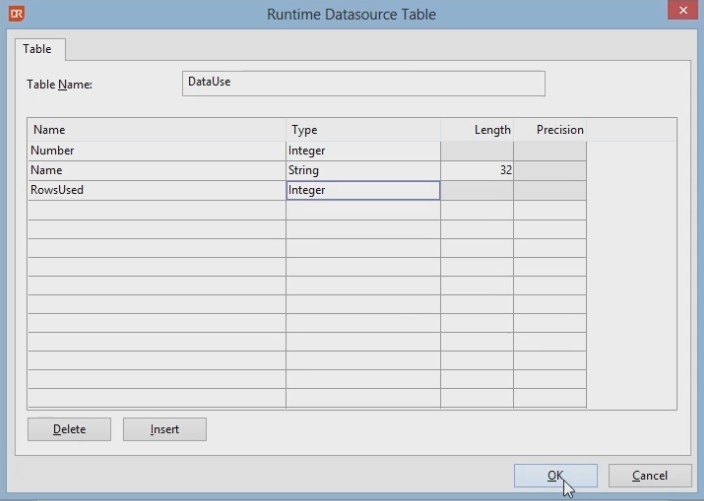
This opens a dialog in which the RDS table name and the columns need to be entered.
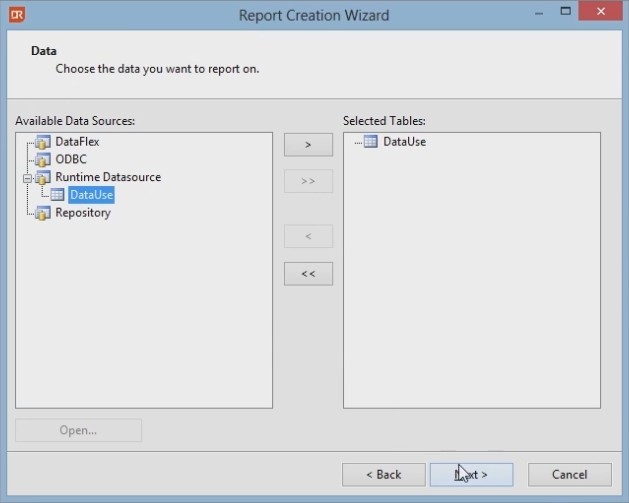
After closing the dialogue, the newly created RDS table structure, needs to be added to the report.
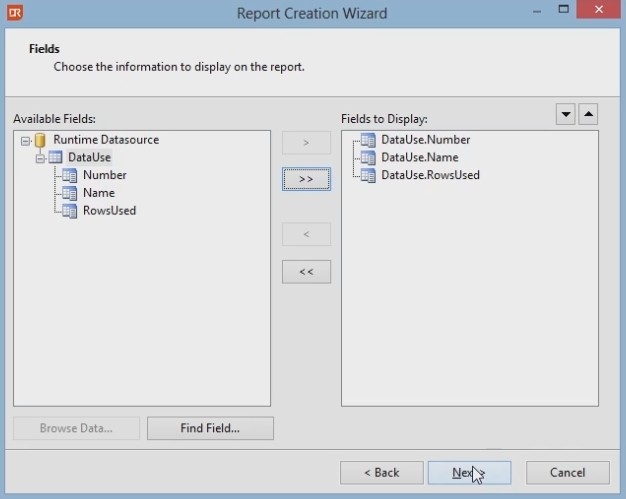
Press next, select all the colums from the runtime data source, and add them to the details section of the report.
Skip the apply filters tab, change the papersize to A4. And finish the wizard.
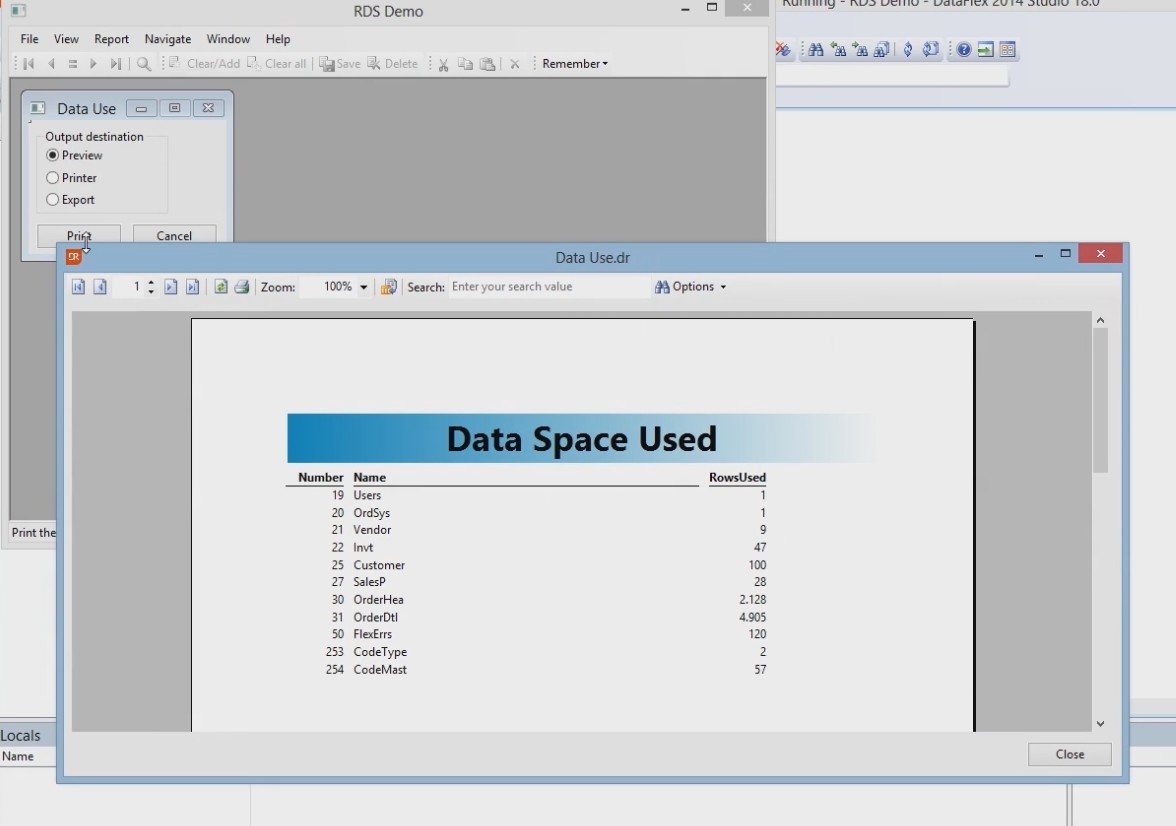
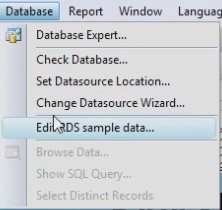
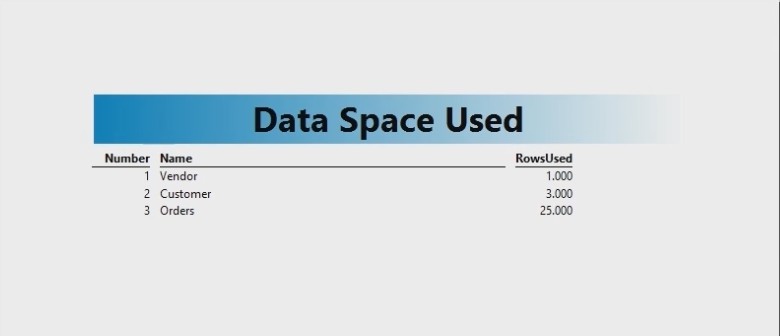
You can now improve the layout and enter some test data, by using the new feature in Data Flex Reports, the RDS sample data dialog.
The DataFlex Reports studio sends the data to the DataFlex reports OCX, which will produce the preview.
Save the report in the RDS demo workspace and switch over to the DataFlex studio.
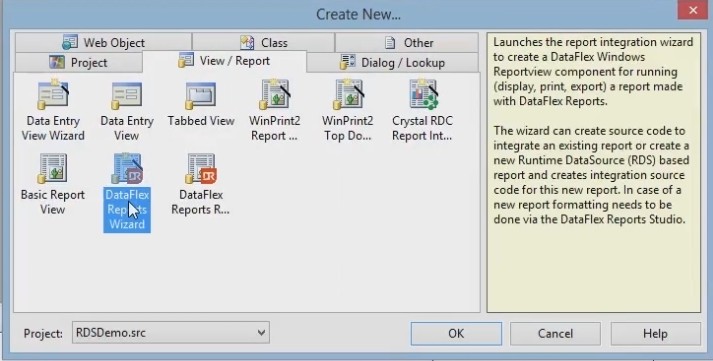
The DataFlex Reports integration wizard helps to get started with the integration.
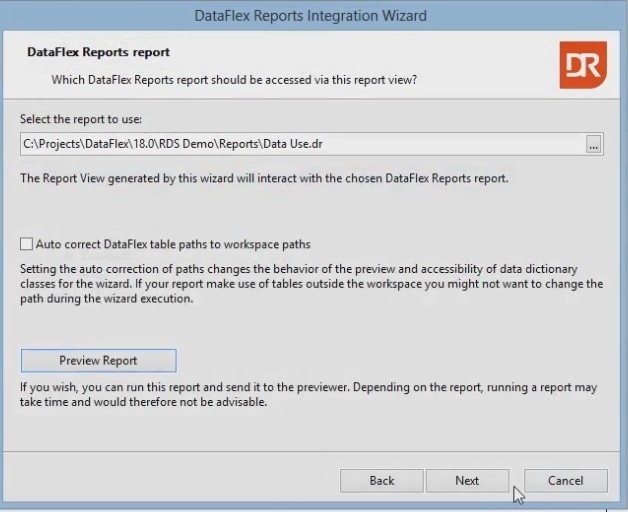
Connect to an existing report. Select the new report previously created, the preview makes sure that we selected the right report.
Accept the defaults for the component names and also skip the selection and sort field pages.
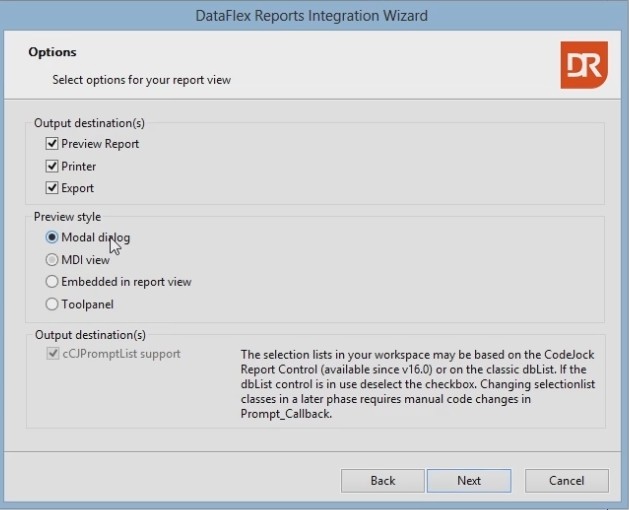
For this plain result, choose modal dialog. Skip the next steps and finish the wizard.
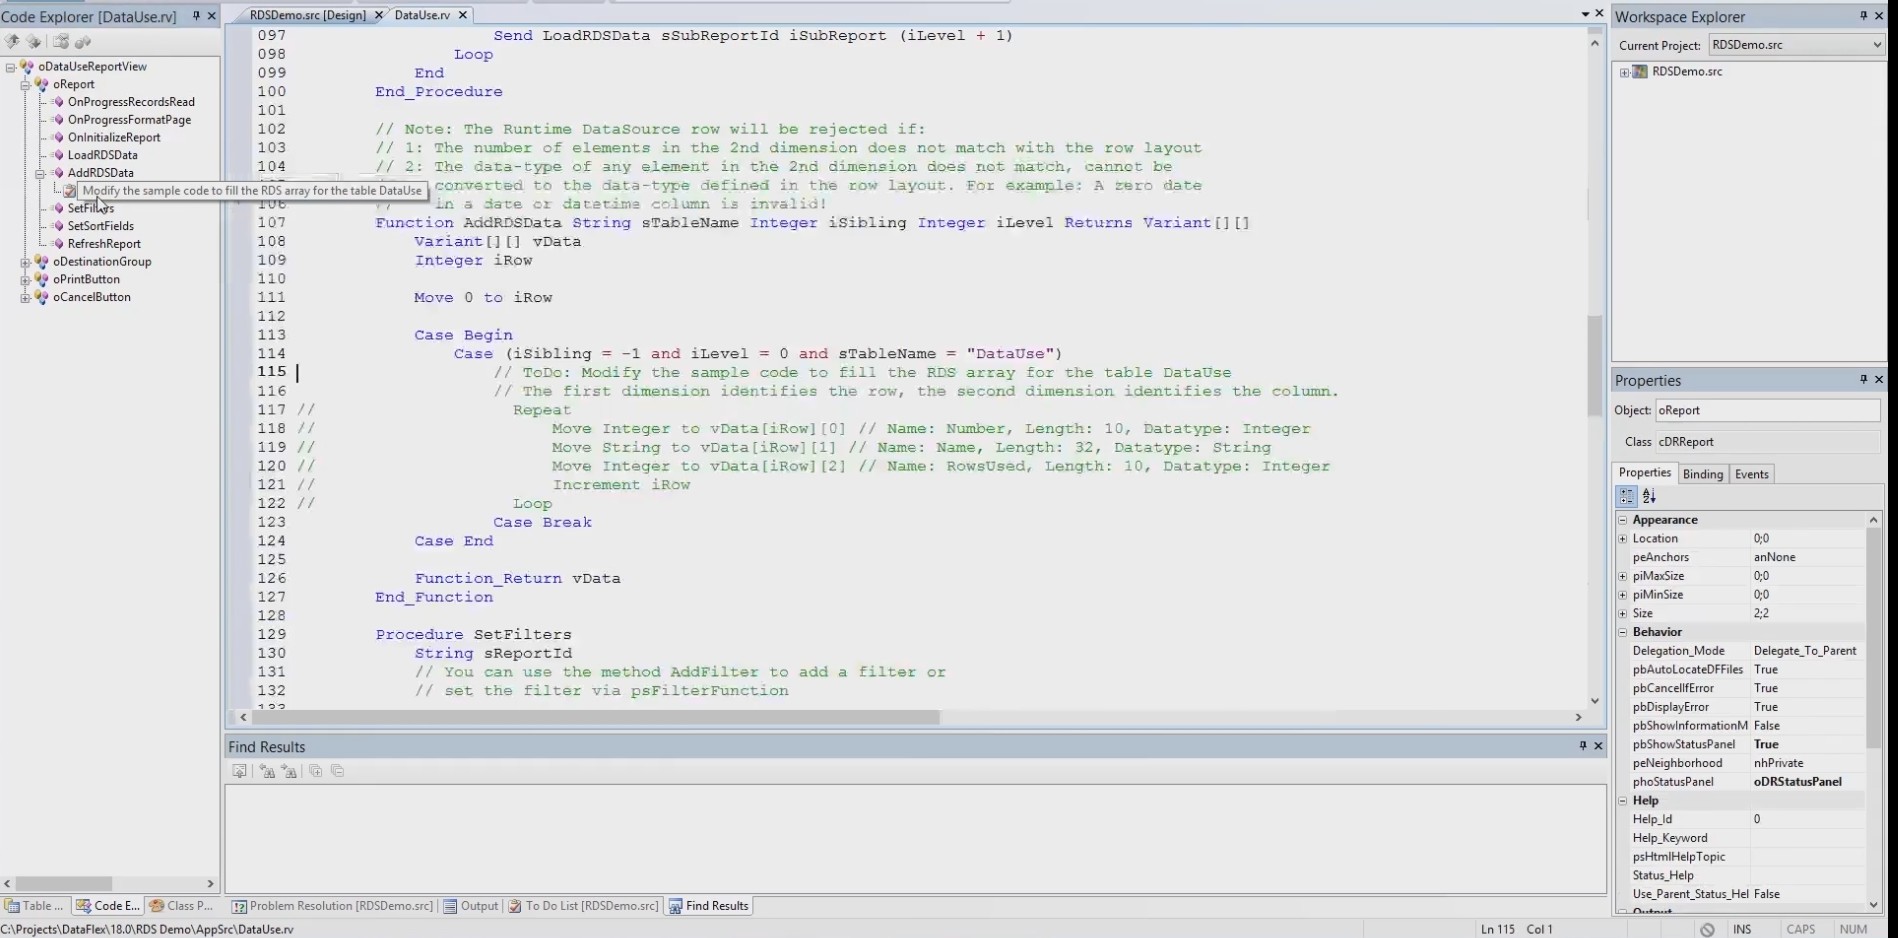
The results of the wizard are loaded in the DataFlex studio, the wizard couldn’t complete all the code because it doesn’t know what data should be placed in the RDS array.
Therefor go to the “to do” item that was created by the wizard.
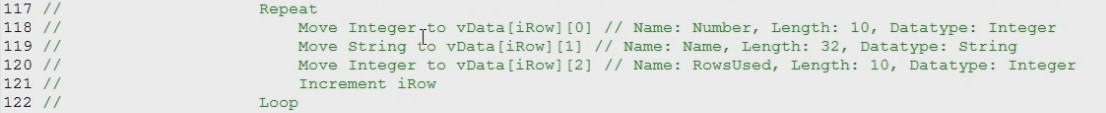
The commented source code starting at line 117 and ending on line 122 needs to be replaced with logic to find the number of used rows in the tables of the database.
This information is stored in the 2 dimension array, named vData. Compile the application to let the preview show the real data.
In this course you have learned how RDS works in DataFlex reports, RDS is very powerfull as it allows you te pre-process data or collect data that is not stored in a traditional database. RDS puts you as a programmer in charge, and with the new features in DataFlex Reports 4.0 and up, it makes your work easier and less time consuming.


 Skip the next steps and finish the wizard.