Quickstart building a web application (Mobile touch)
Lesson 11 - Testing the application
Now that we have created our application, we're ready to test it. So far, we have been testing our application by clicking the play button.
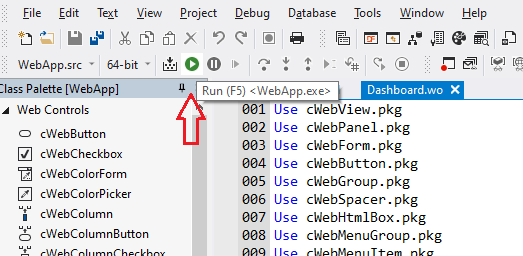
This starts the application in debug mode and opens it in the browser. What a lot of developers don't realize, is that web applications run continuously in the background. As soon as your web application is registered, it runs in a web server. And you can access it all the time.
DEMONSTRATION
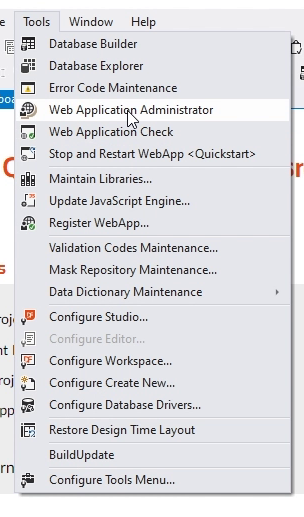
- You can see it by looking at the web administrator, which you can open from the tools menu.
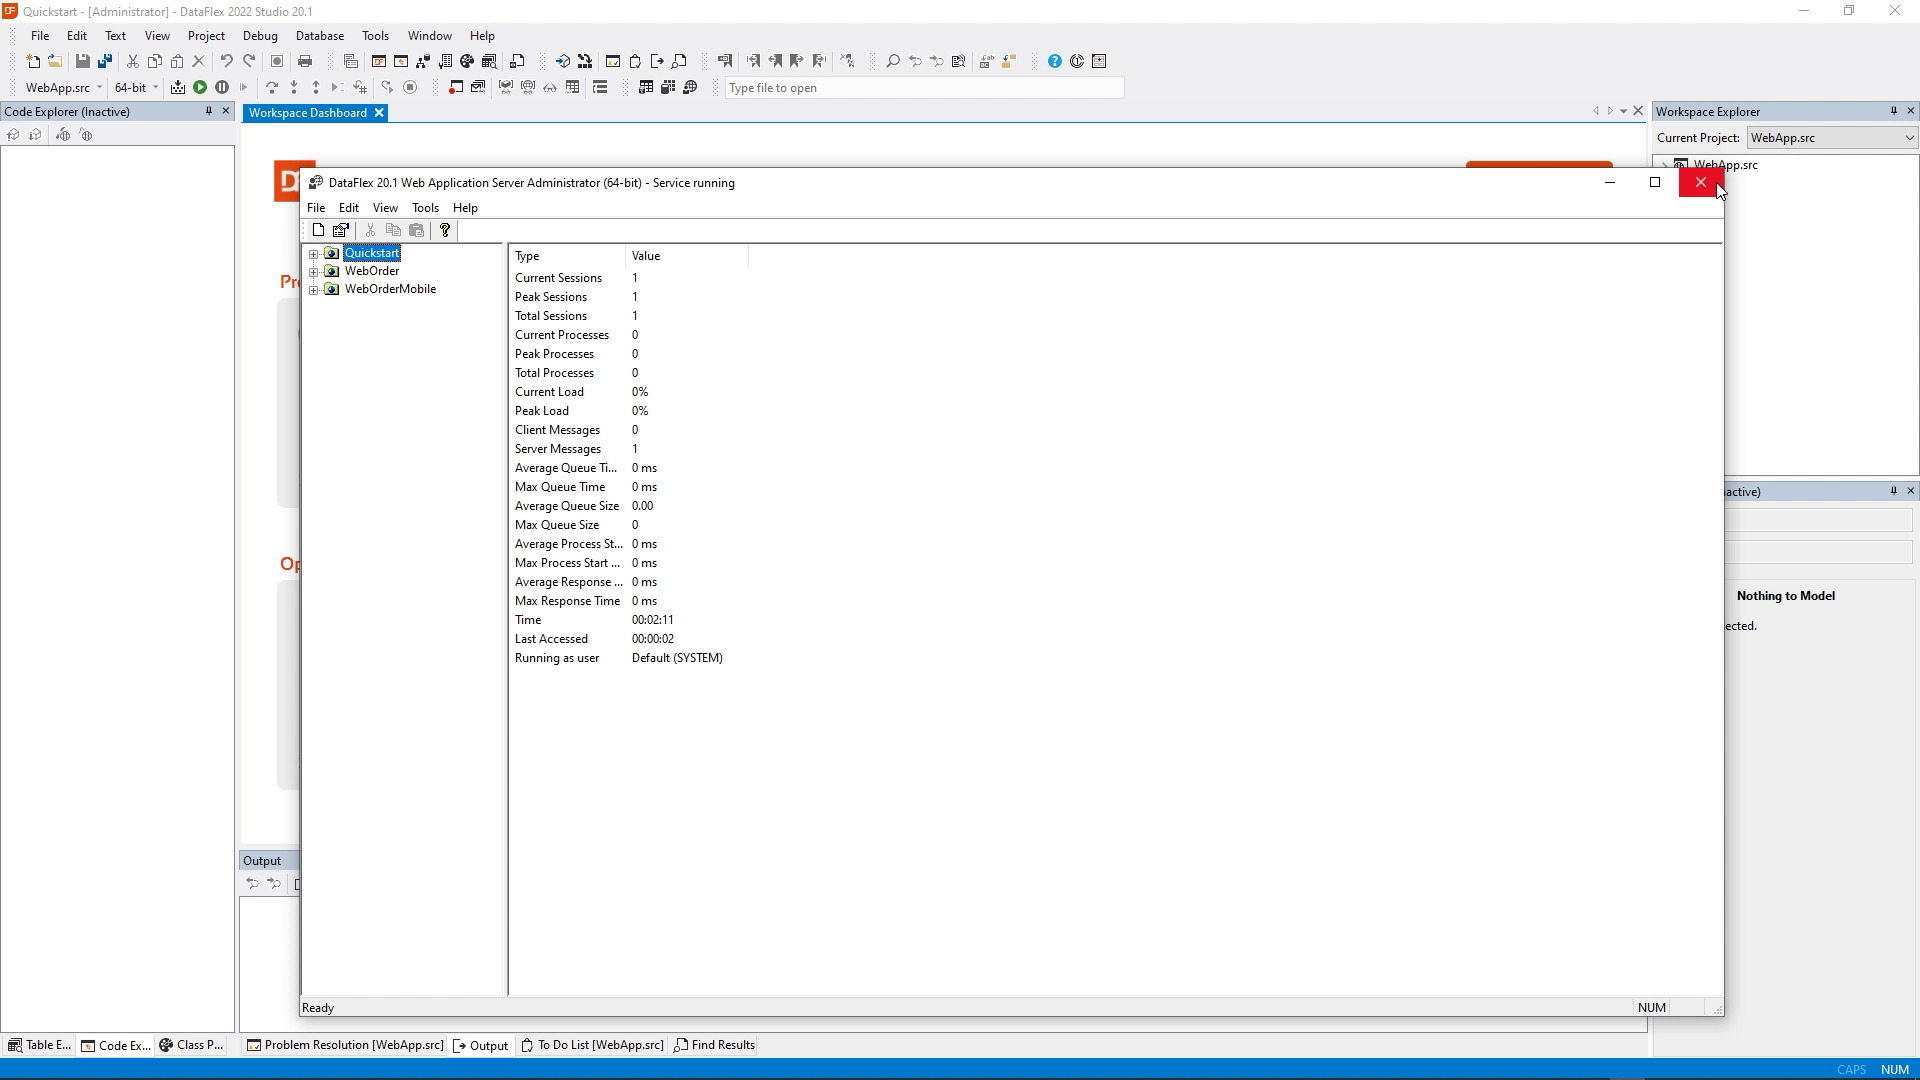
- Here we see that our Quickstart application runs, that there are two processes running right now. And that it already has processed some messages from the client.
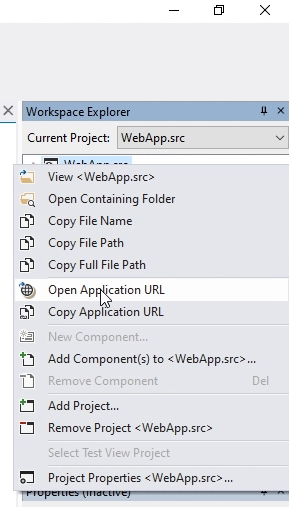
- You can also open the browser by right clicking on the workspace explorer and saying open application URL.
- Now you see that it doesn’t work yet.
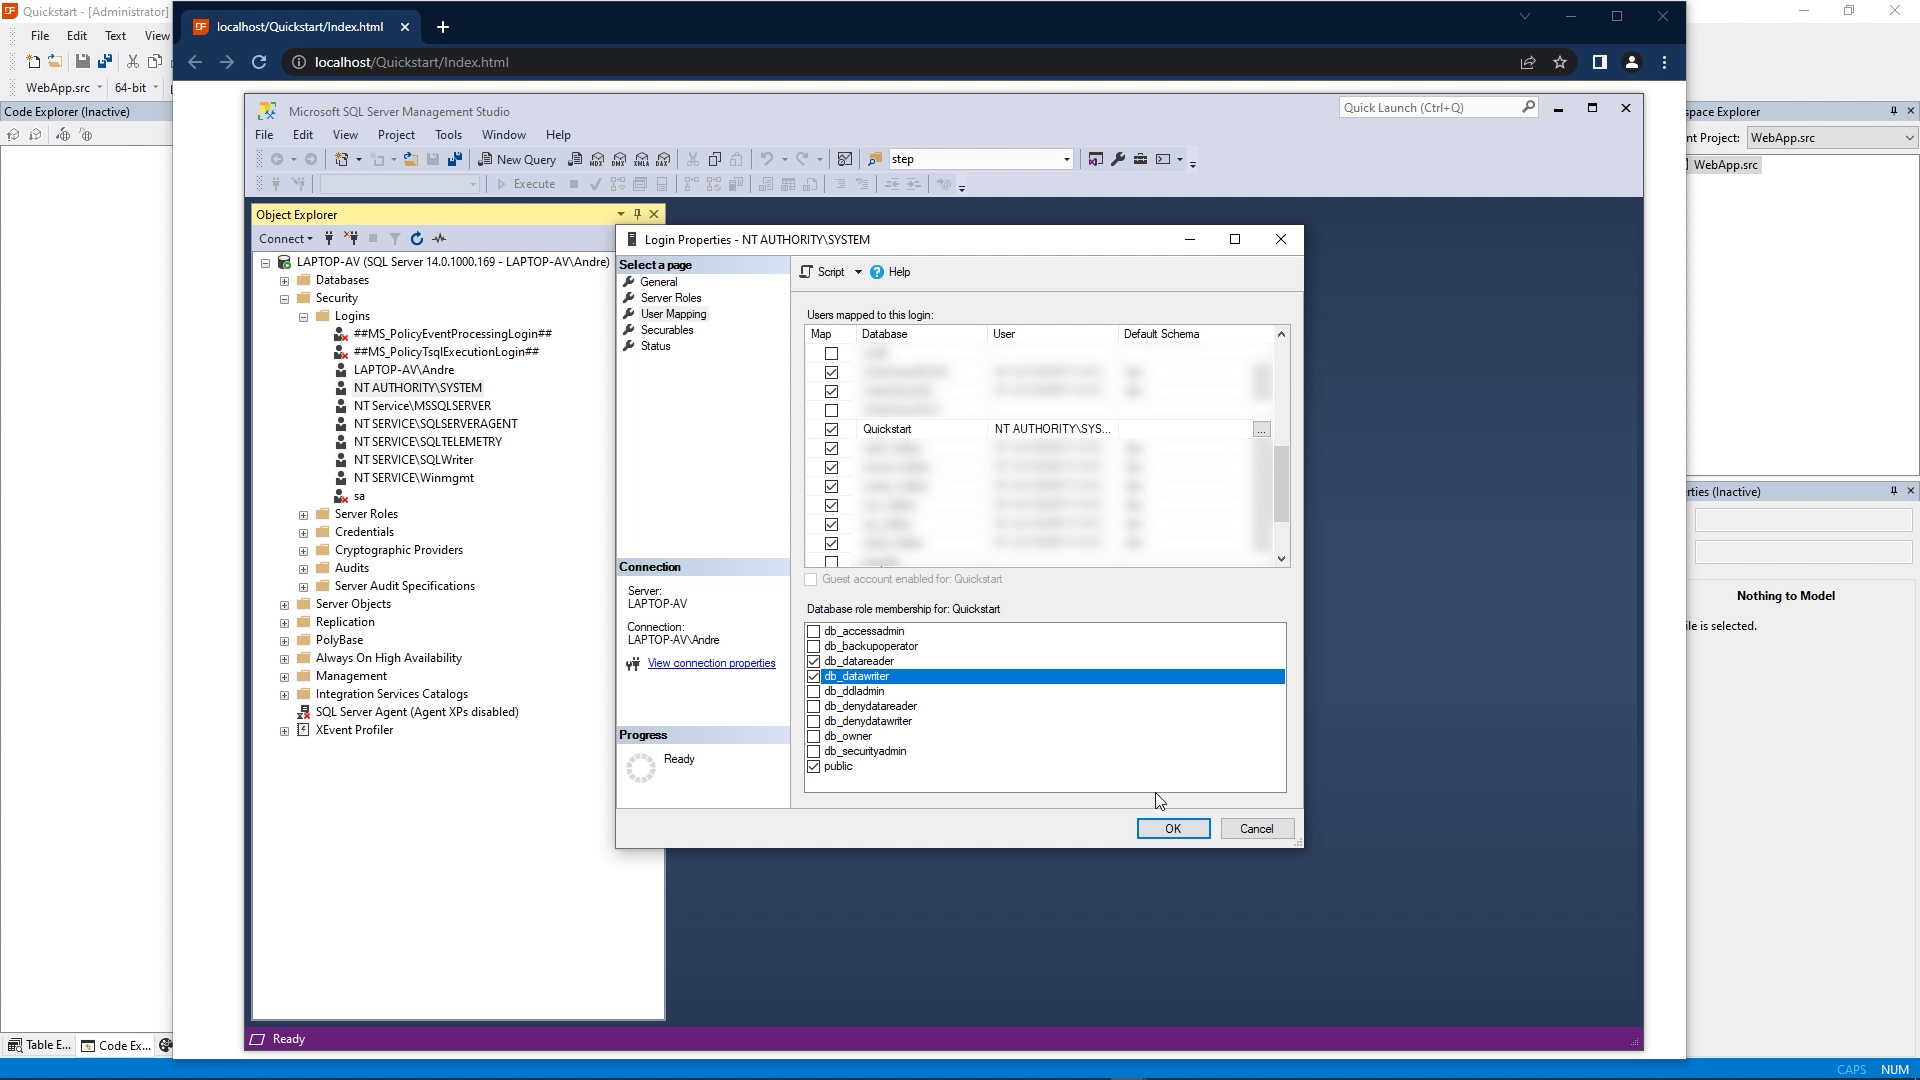
- Whenever you see that an application runs fine in the debugger, but not without the debugger, this is most often due to insufficient rights at the database level. In SQL Server Management Studio I go to: Security > Logins > NT Authority System. And choose properties, select User Mappings. And go to my database. There I switch Map on. And below I select db_datareader and db_datawriter and click OK. I go back to the browser and do a refresh.
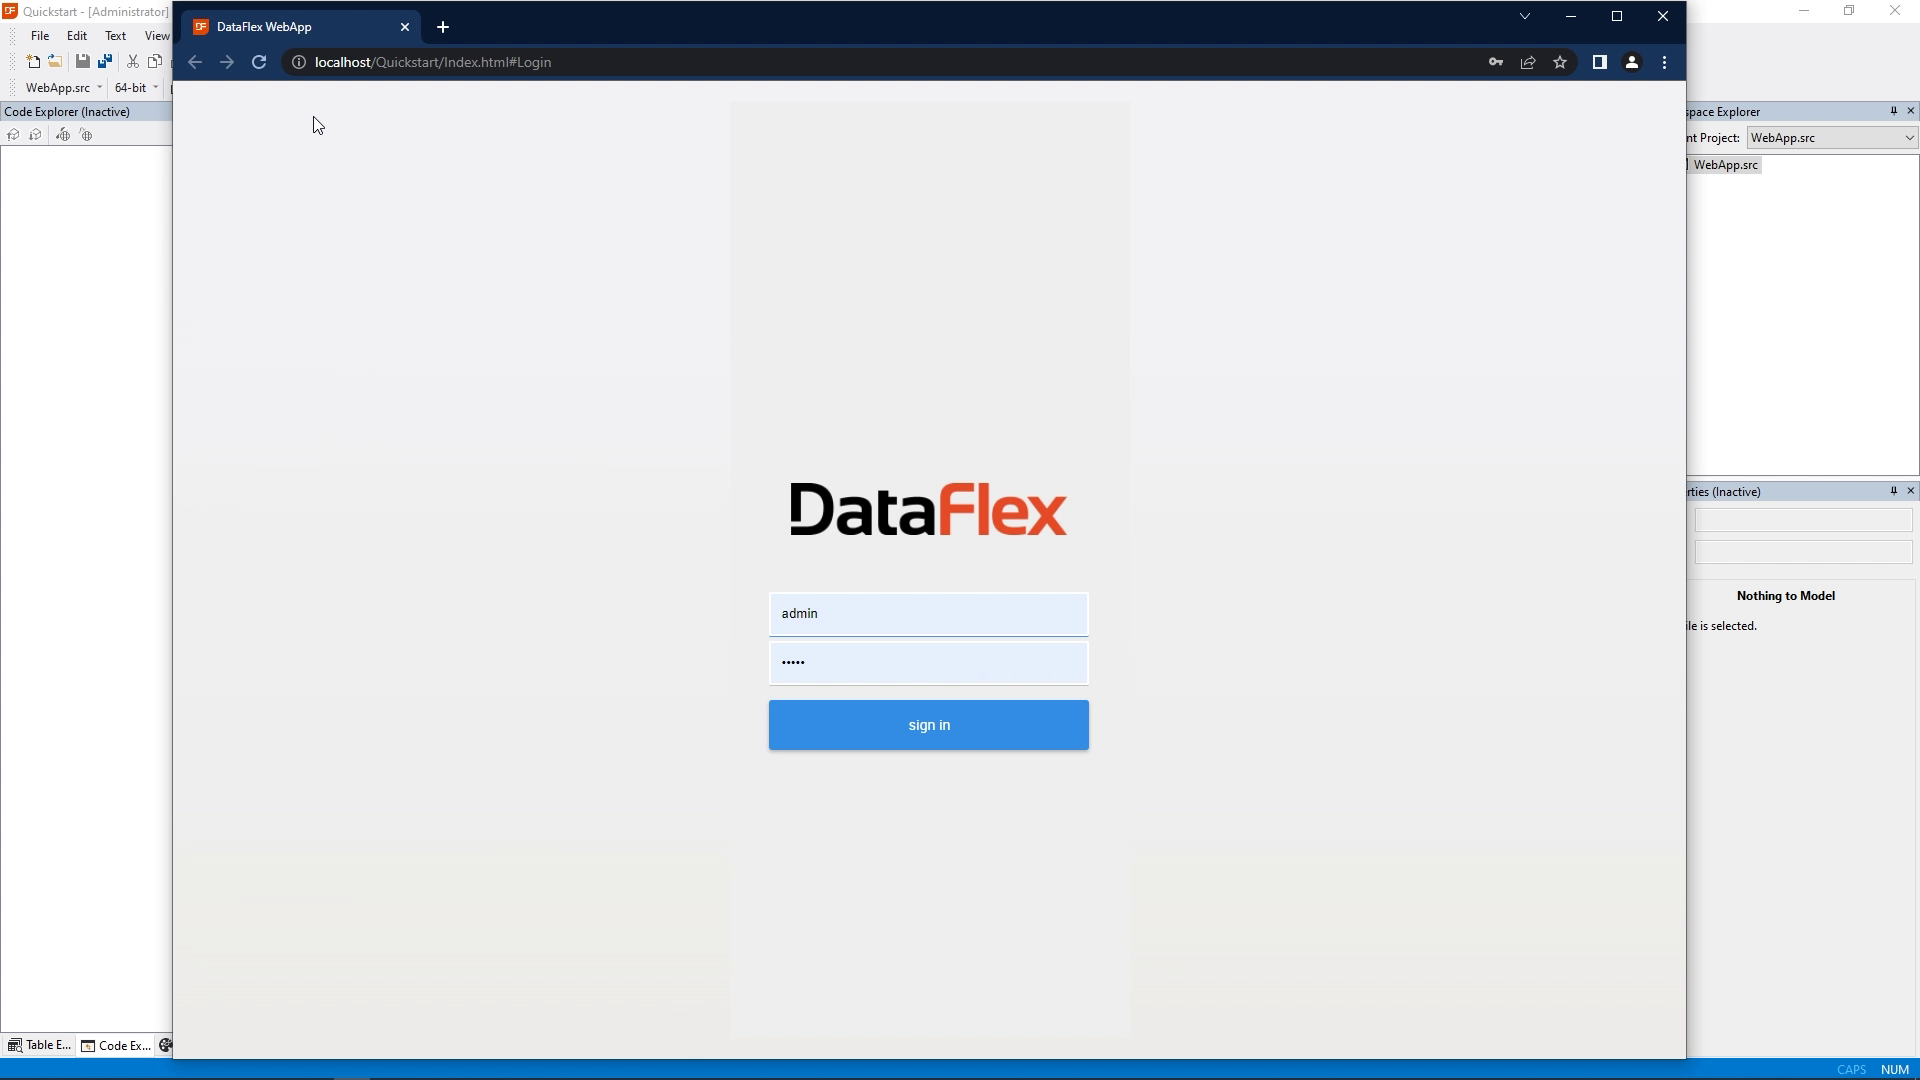
- And now you see that it runs in the background without running in the debugger.
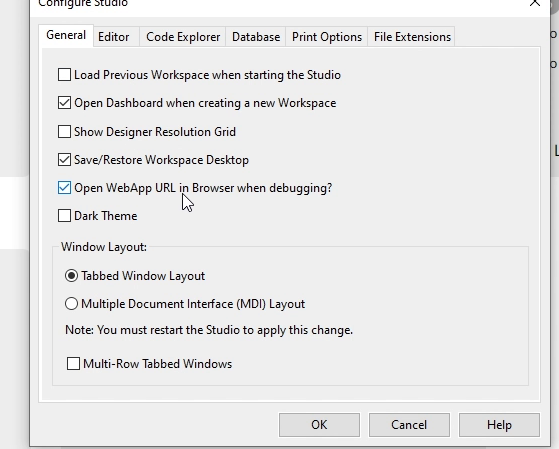
- A nice feature of the Studio is the option to disable it from opening the browser as soon as you start debugging. So I'm going to tools, configure Studio. And here's an option Open WebApp URL in browser when debugging. If I uncheck that, I can start debugging without it opening a new browser window. This allows me to keep my browser window open in the background. And this also means that I can change my application and then go to the browser and refresh without having to log in again.
- So you can make changes to your application while you're running it inside the browser. You just have to refresh and it will reload the changes.
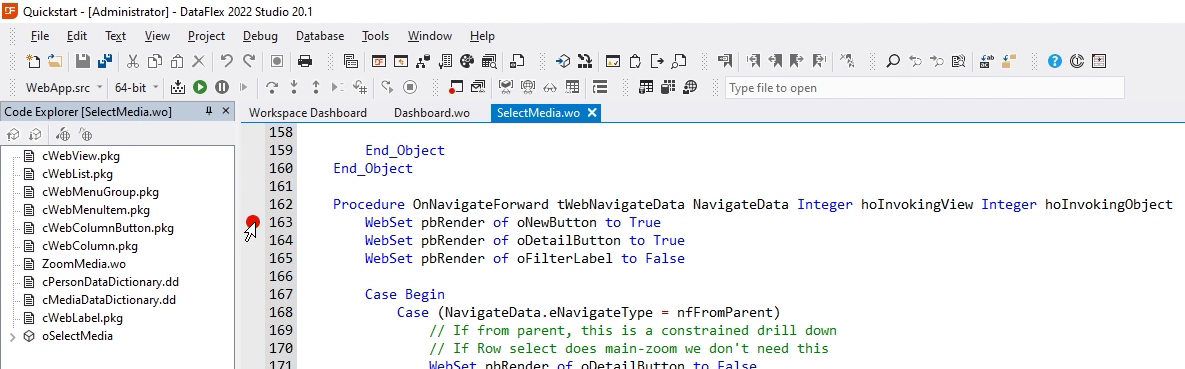
- Important when testing your application is that you're also able to debug your application. Within DataFlex, you can set breakpoints.
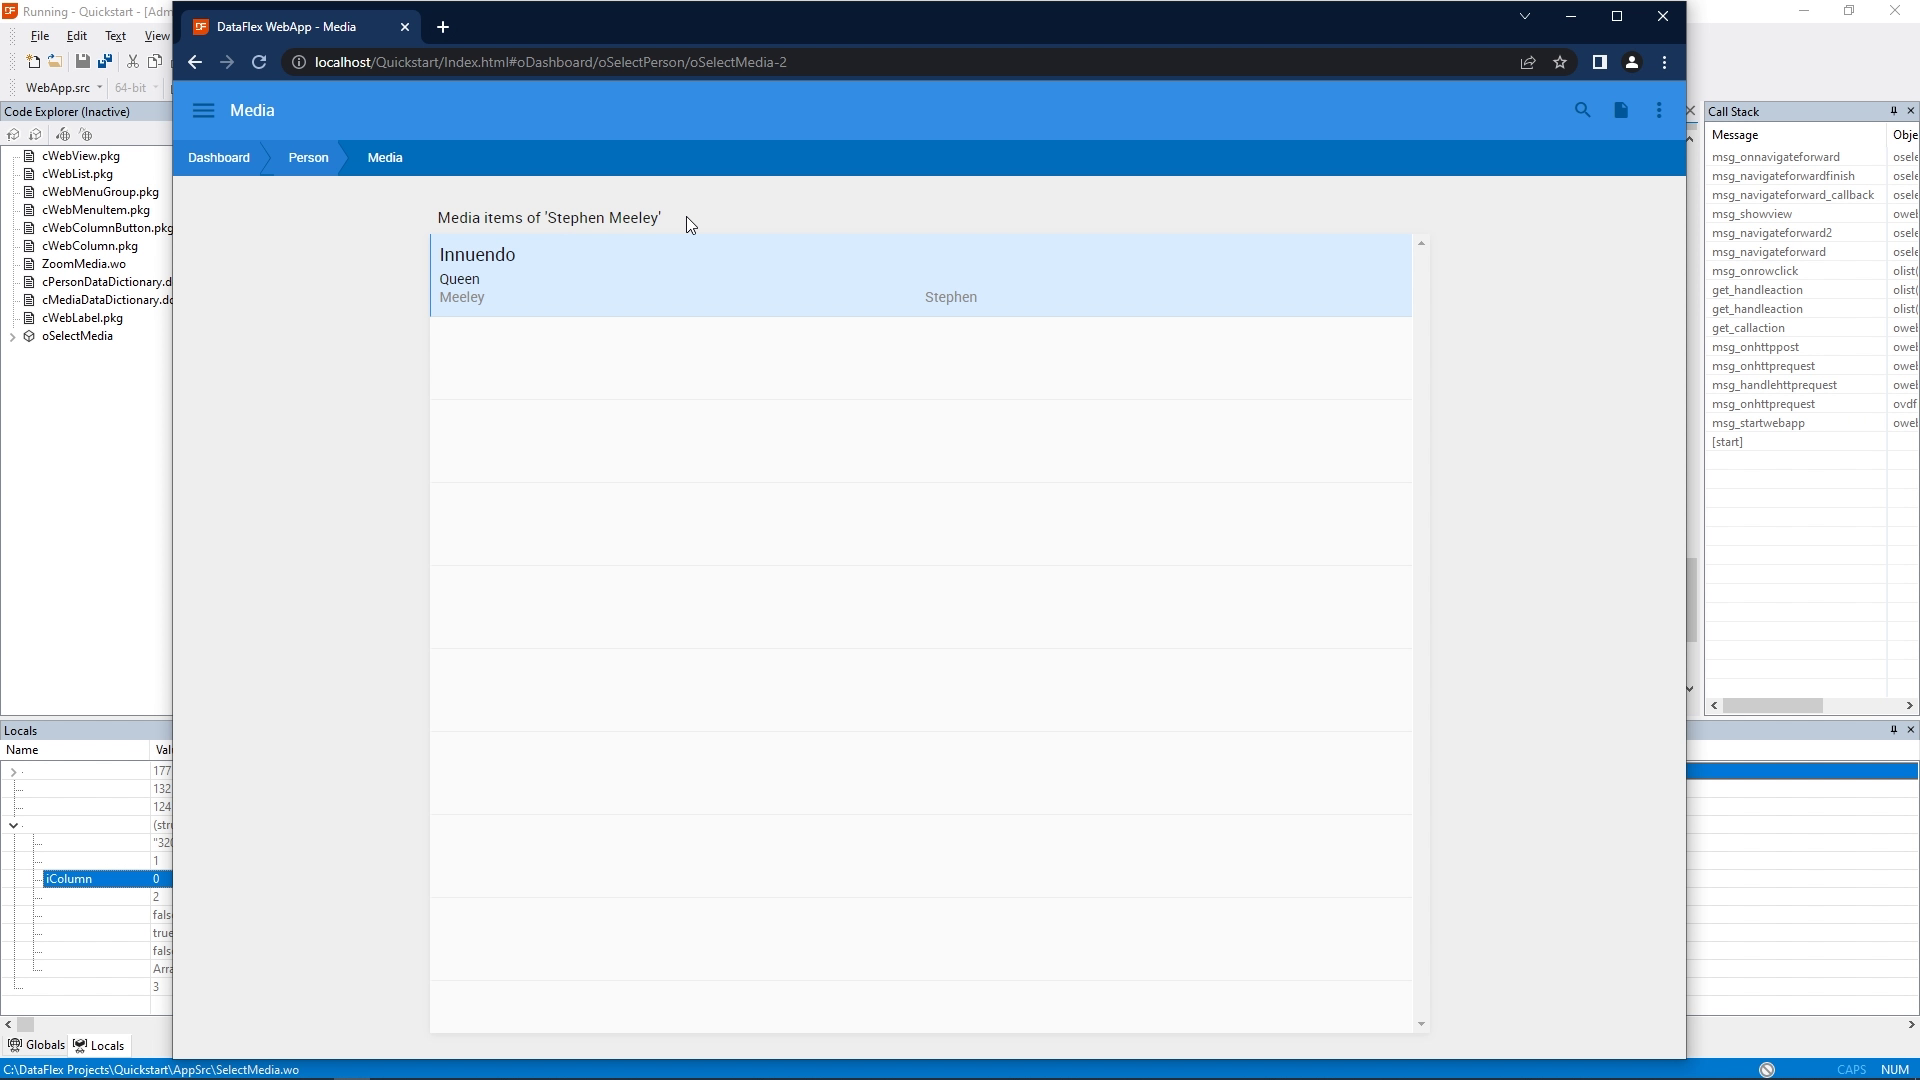
- What we're going to do now is we're going to put a breakpoint inside the Select Media view, here, inside OnNavigateForward.
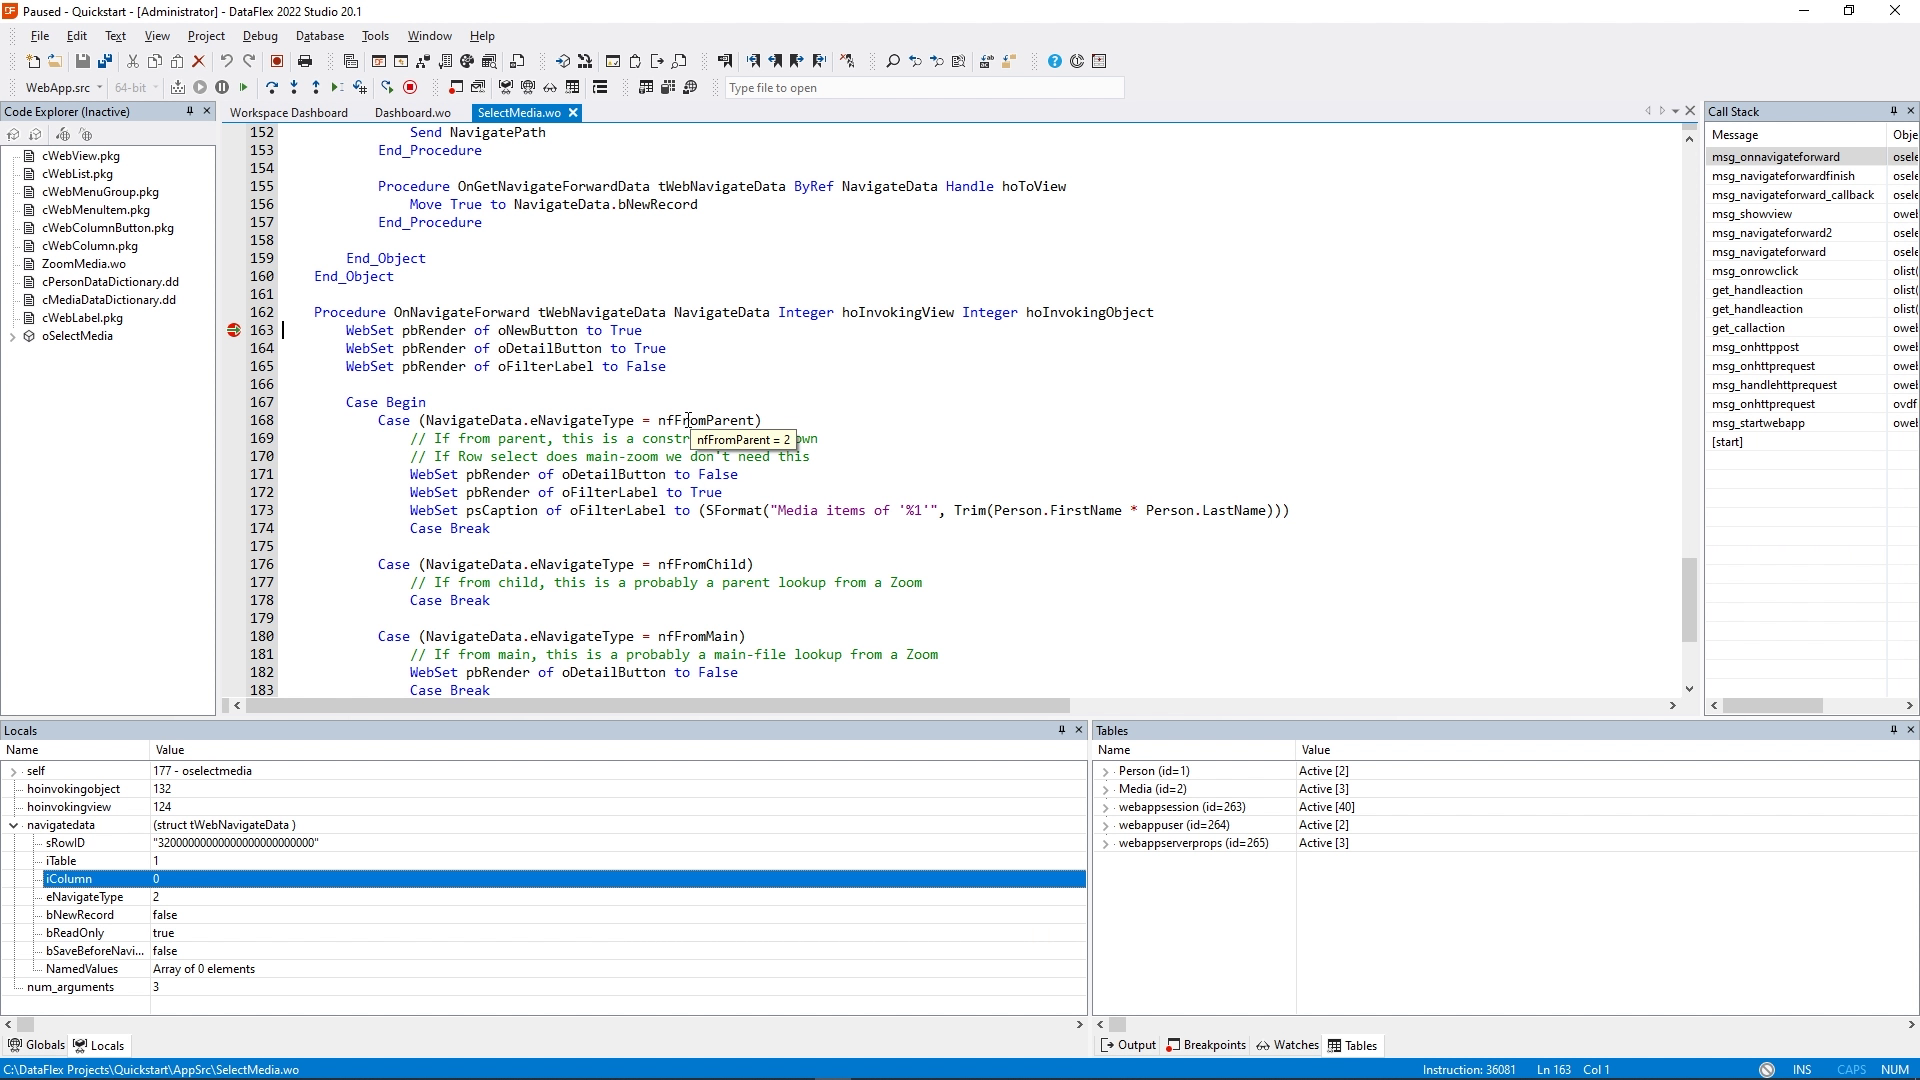
- So now I have to start the debugger. Else the breakpoint won’t be hit. And I go back to my browser. And I can click “Query persons” and click on a person. And now it hits my breakpoint inside select Media.
- If you look at the debugger, there are several panels available and one of them is the locals, which shows the Navigate data that we have been discussing in one of the previous lessons. And here we can see that the navigation type is 2, which matches nfFromParent.
- And I can step through the code using F-10. Or using the toolbar icon here.
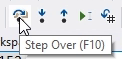
- Step over, and see that it steps into this case statement, enabling the label.
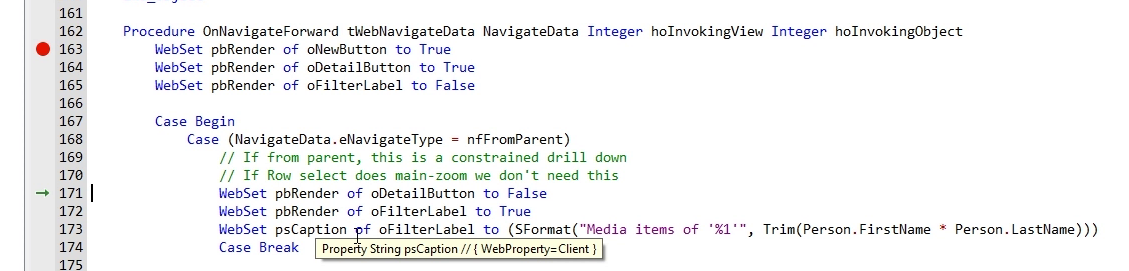
- And if we look at this line of code where it generates the psCaption, we see that it uses the person first name and person last name.
- And in the tables panel we see all the tables and we see that person is active and has a record Stephen Meeley in it.
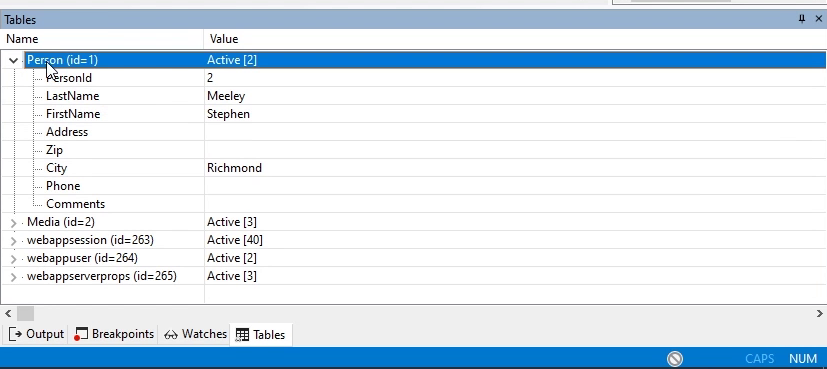
- So this means that the label will contain Stephen Meeley.
- I continue running. And go back to the browser and we see that now. It says media items of Stephen Meeley.
 When developing applications for several devices, it's interesting to see how a screen behaves on a specific device. Chrome has a nice method of emulating different devices.
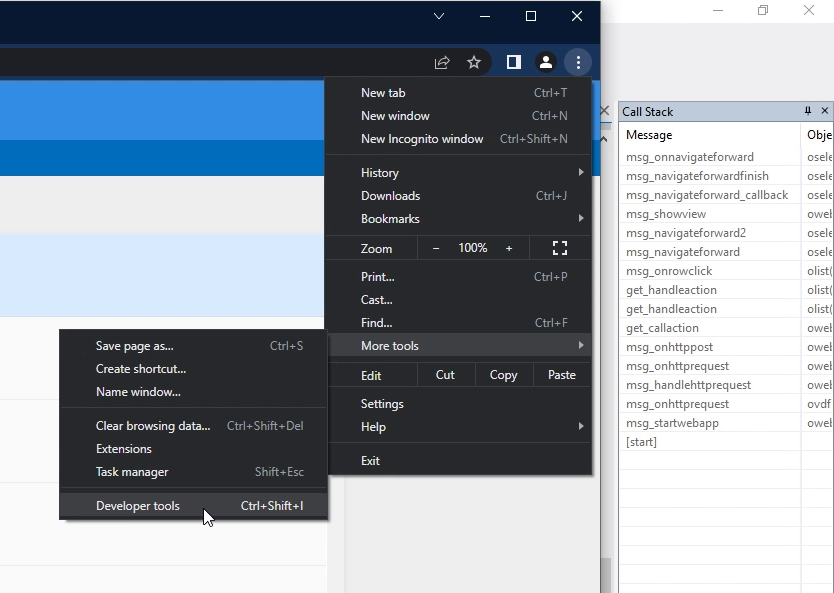
You can find this if you go to the menu of Chrome, more tools, developer tools.
And in the upper left corner, there is a button called toggle device toolbar.
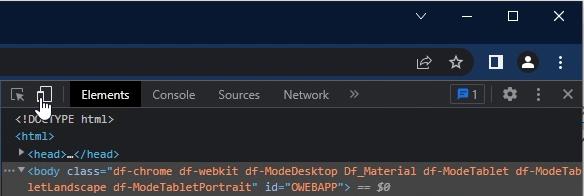
And if you click that, you see that it now emulates the screen size of an iPhone. In this case the iPhone 12.
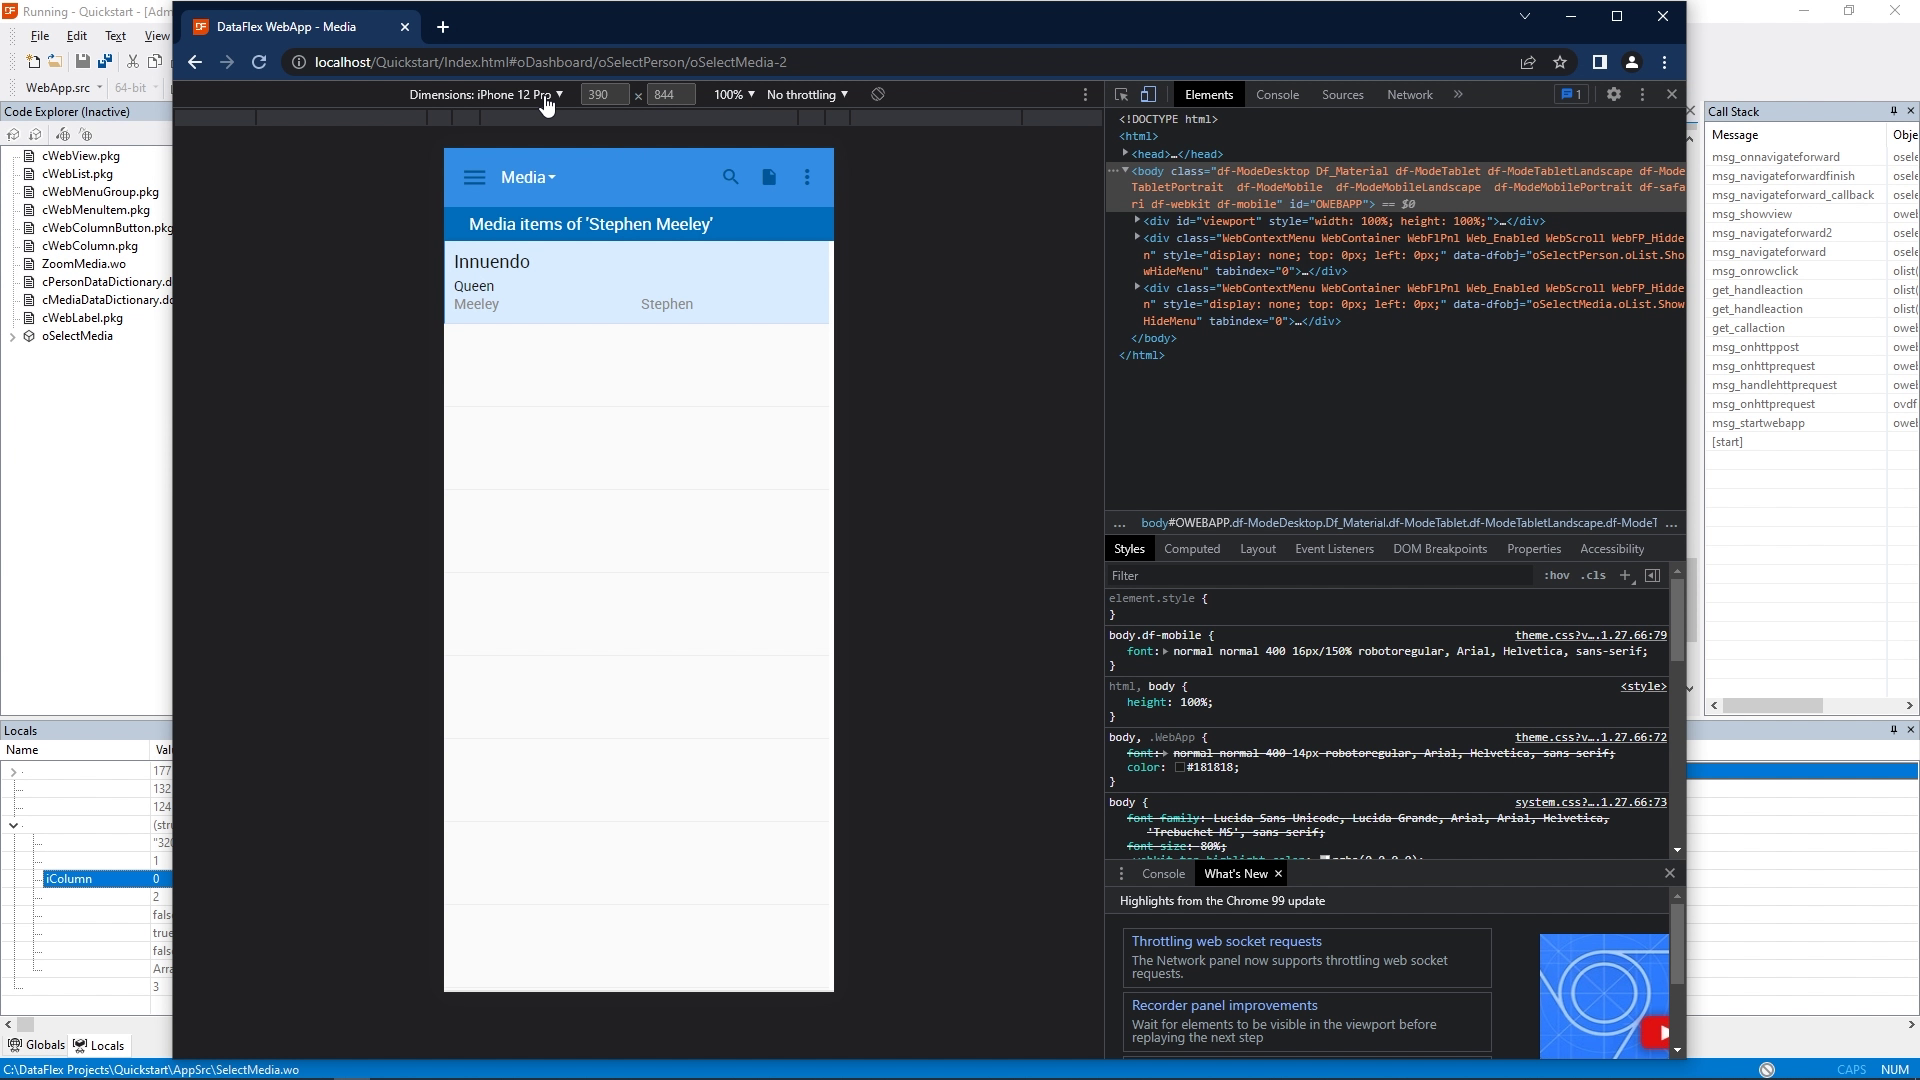
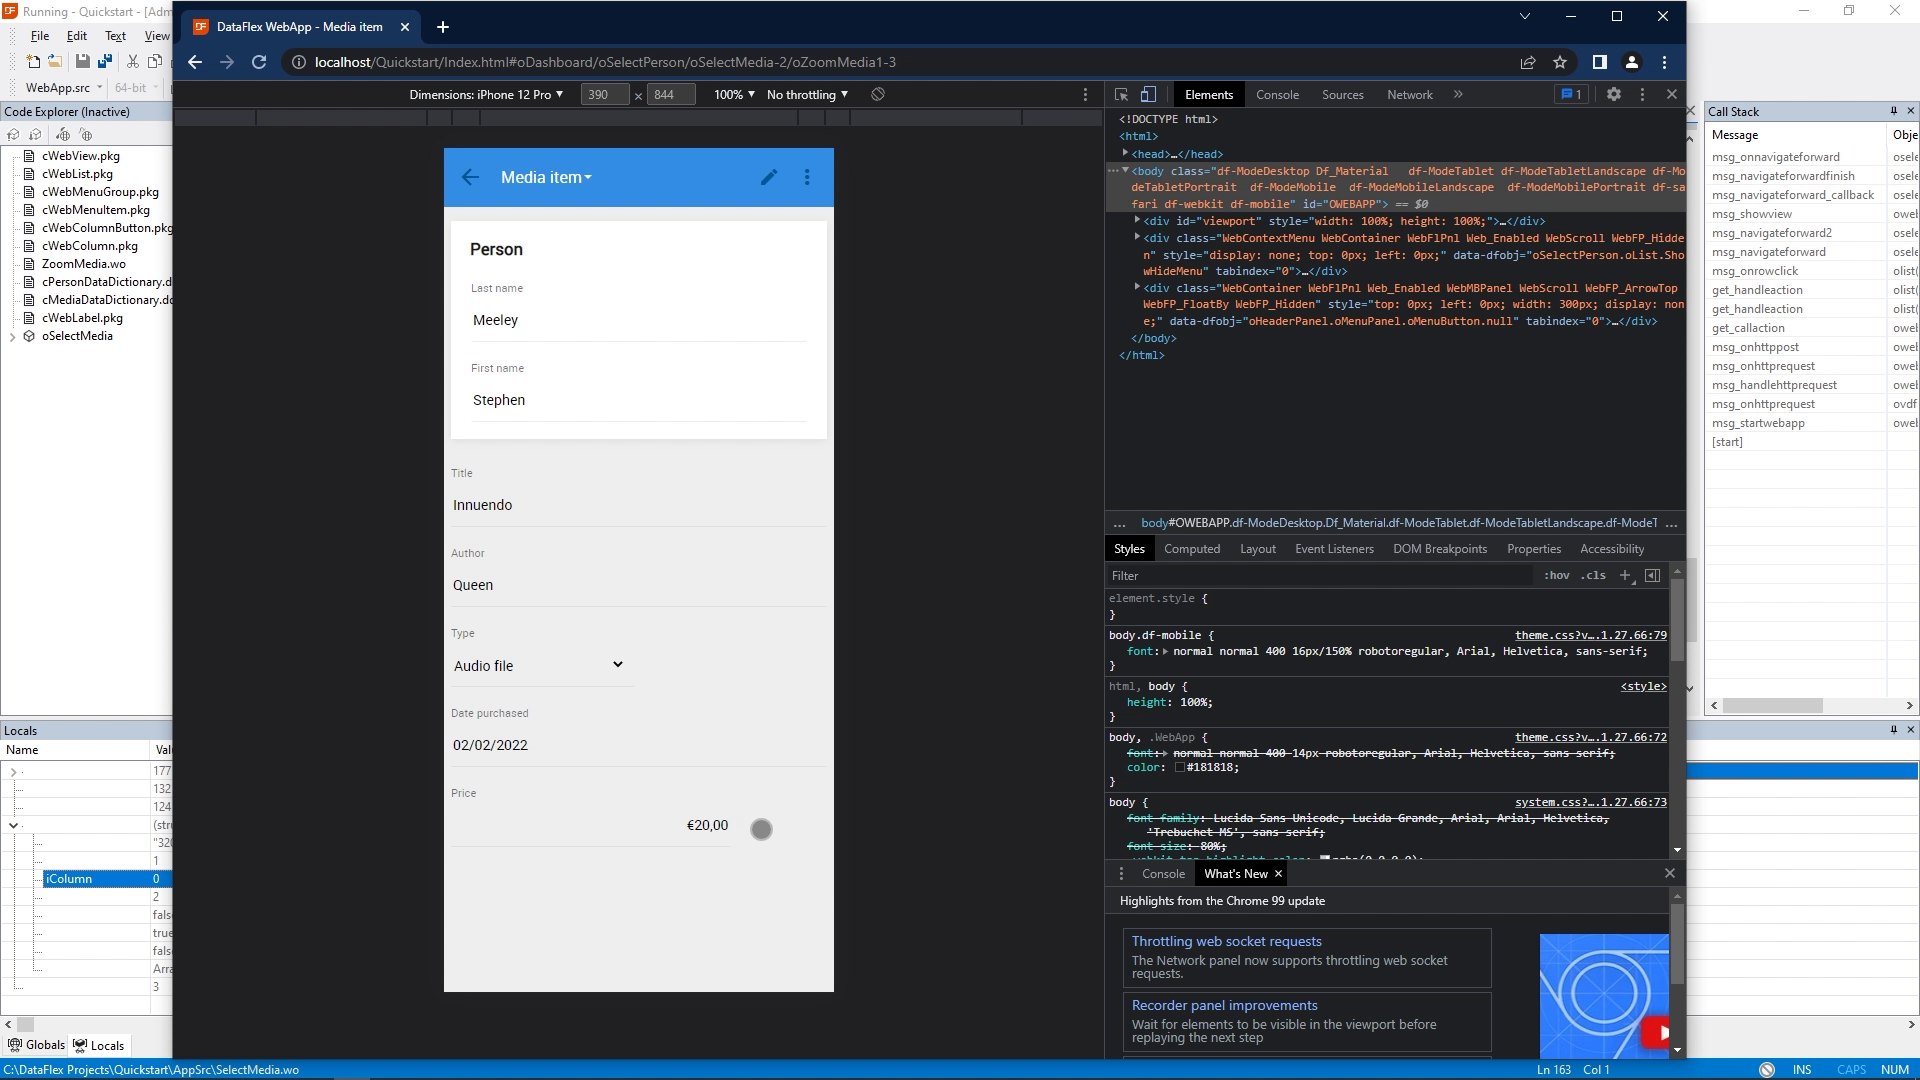
You can select different devices to get different screen sizes. And what you can also see is that parts of the application are responsive. For example, this one label has a special CSS class, which makes it blue, now that we have this different screen size. If we look at this view, for example, we see that it has pushed different things underneath each other.
You also see that the cursor now is changed into a little bullet which kind of emulates a finger. This means that you can also test touch gestures. So in this case, you can see the elastic scrolling of the web list.

This also allows you to test other touch features of the webapp framework.
So now you know how to test your application in several ways.
This finishes the debugging lesson and this Quickstart!


