How to deploy your WebApp
Lesson 5: Understanding Process Pooling
Process pooling plays a central role in how WebApps function, so it’s important to understand how they work and how to tune the process pool for the best combination of performance and stability. WebApps use web service calls to access the server processes. Before a web service request can be handled, the web application must be loaded and initialized, and all data tables must be opened.
When a browser makes a request, the Web Application Server goes to its process pool and assigns the request to the first available process. When the response is completed, the Web Application process is returned to the pool. Since the Web Application process is already loaded, the process of attaching and detaching a Web Application process to a request is very fast. And, since a properly written request is compact, the number of requests that can be serviced by a single Web Application process is very high. The result of this process pooling is faster performance with less resource usage.
Processes are not being constantly loaded and unloaded and tables are not being constantly opened and closed. The min and max pool settings control how the pool is managed. When the server starts your WebApp the min pool setting determines how many processes will always be available for handing requests and the max pool determines how many processes would be needed during peak load times.
Demonstration
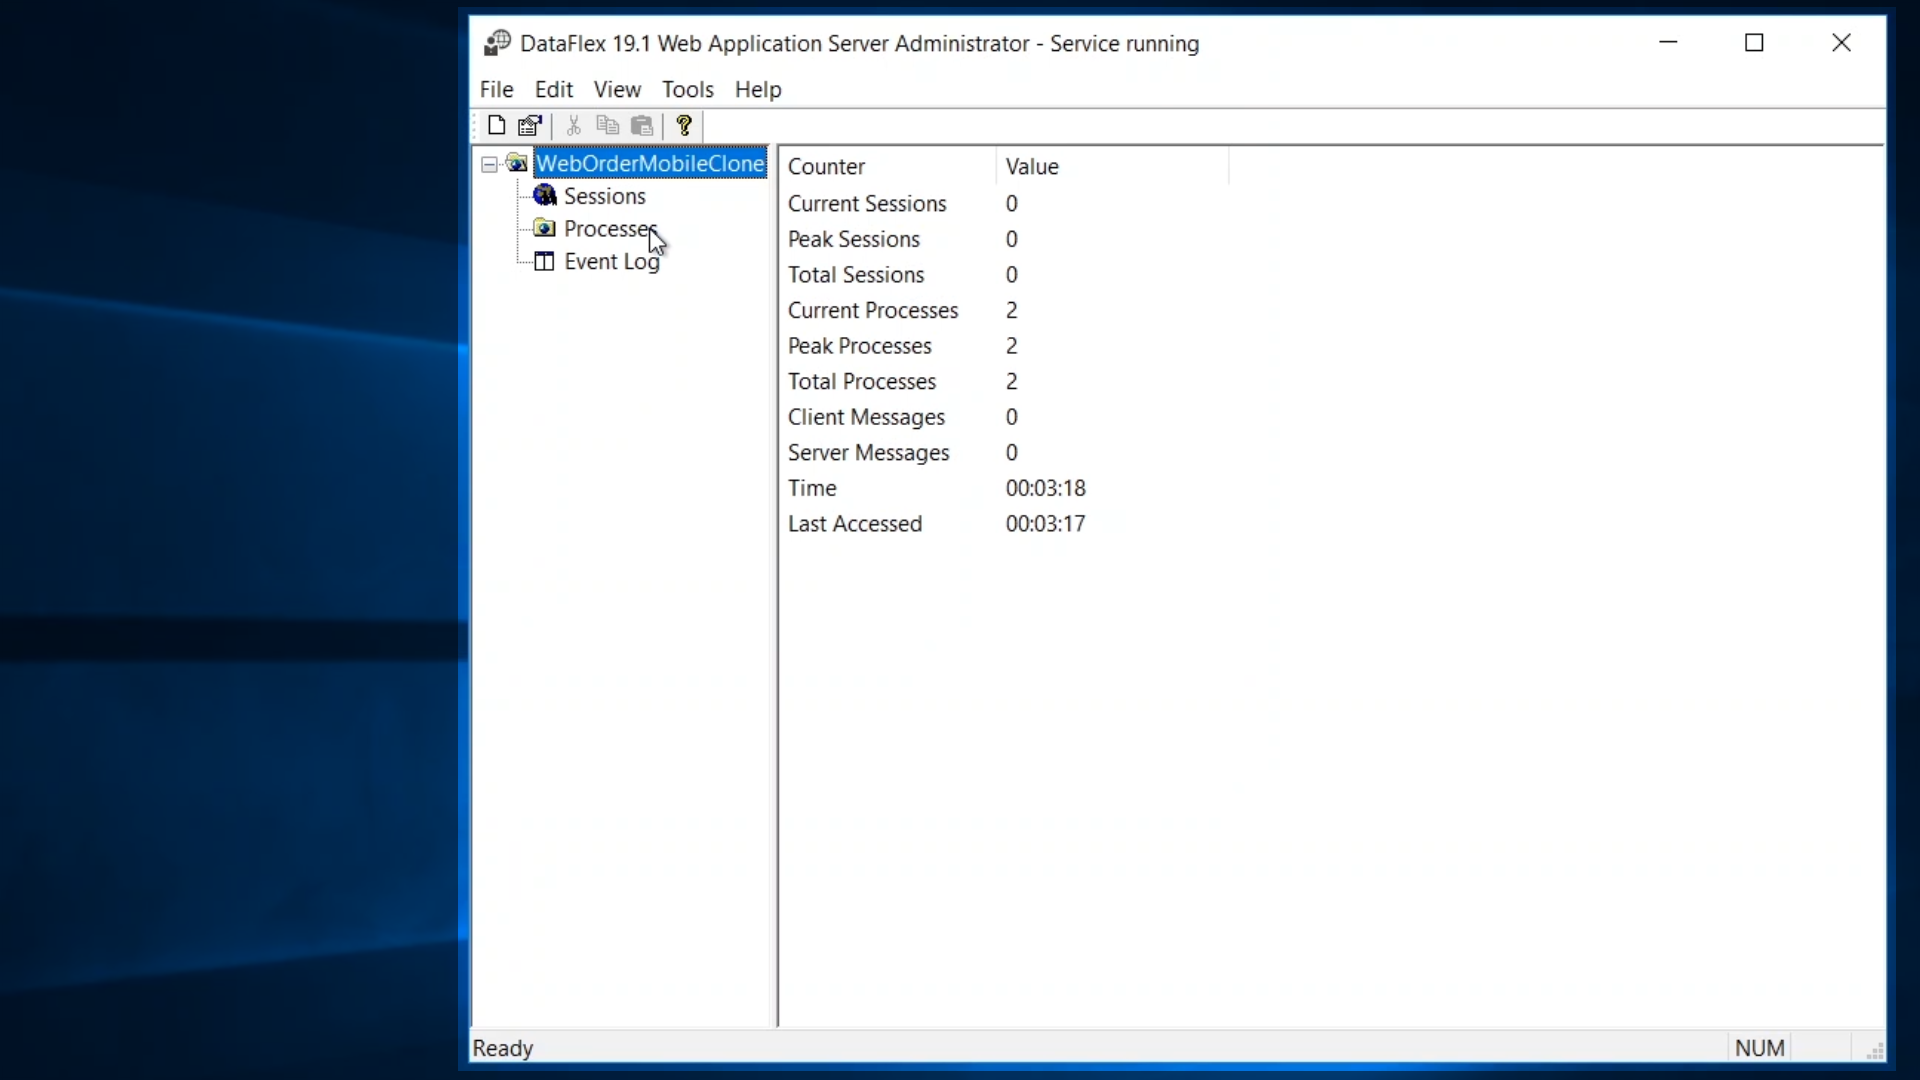
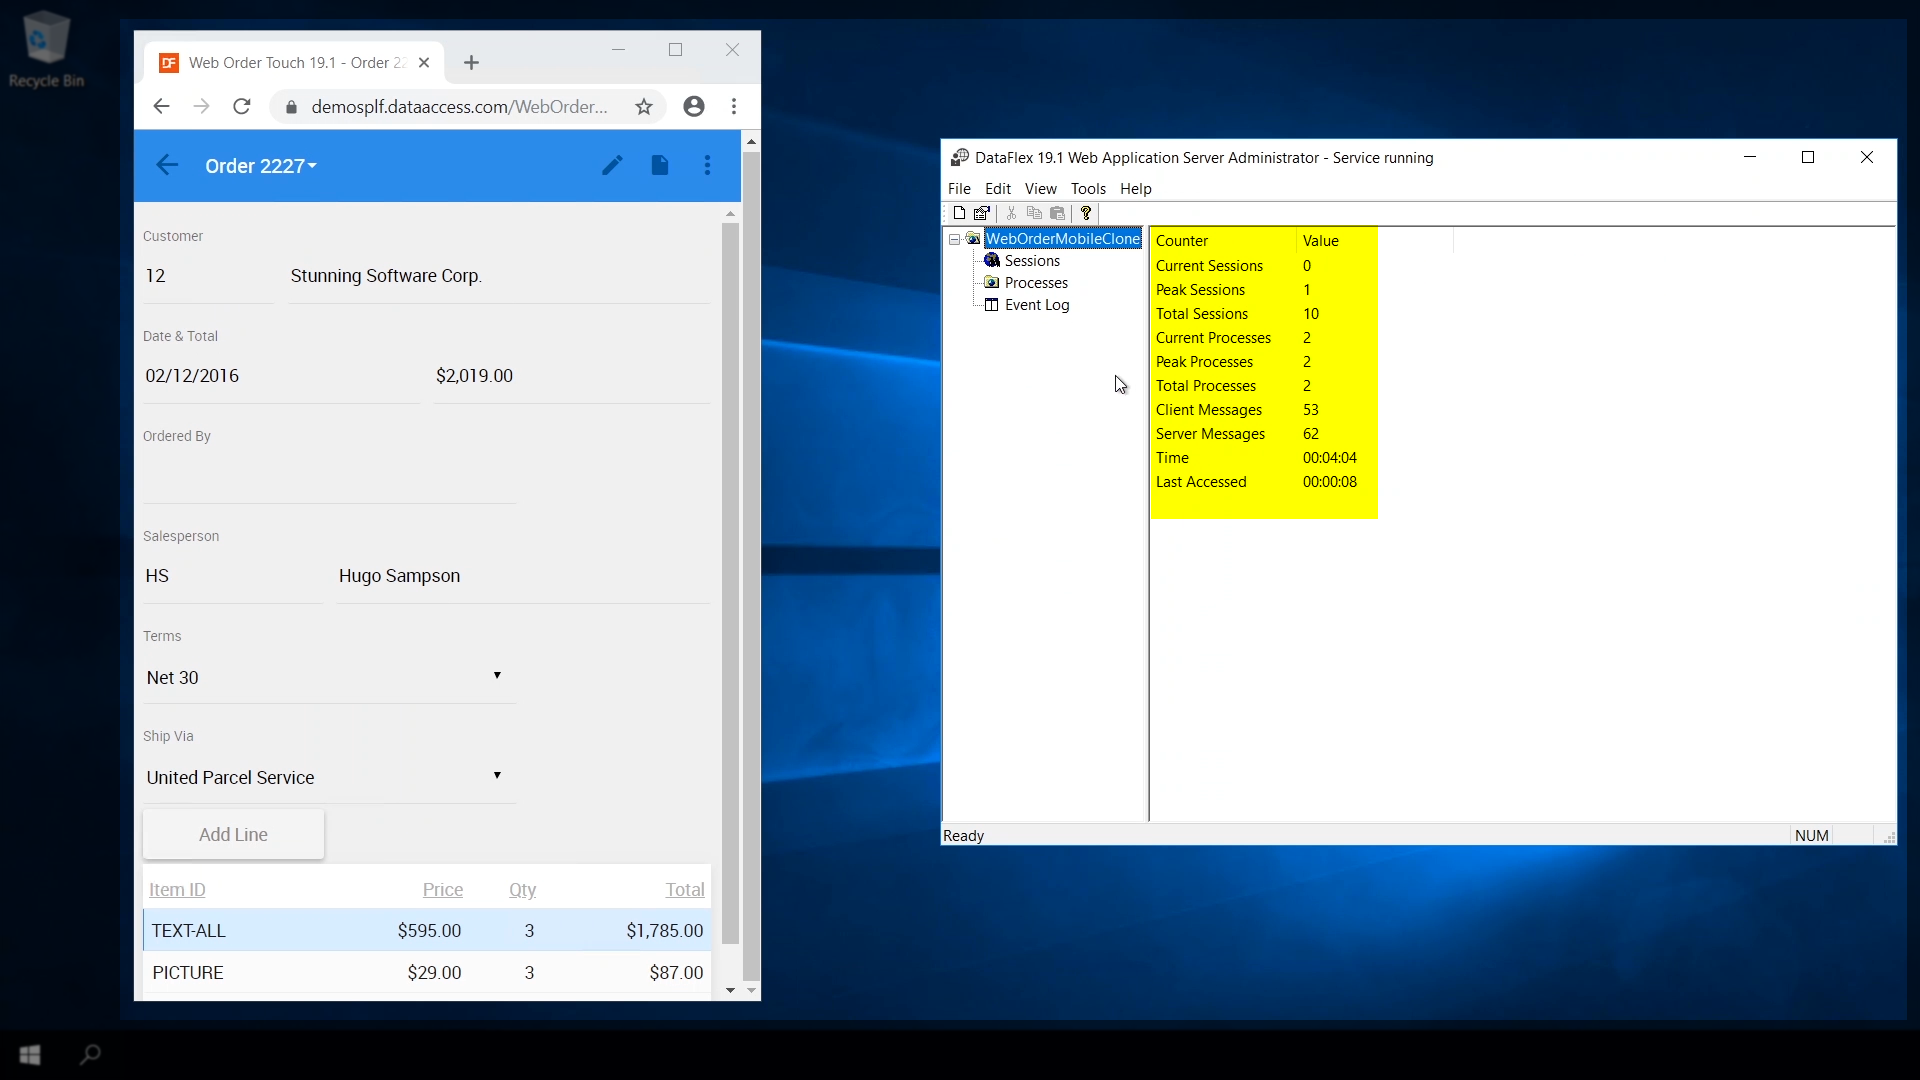
How ‘process pooling’ functions and how to use the information the server provides to manage the pool for the WebApp. The WebApp Server has been restarted, so that all the metrics are reset for the WebApp. The Administrator shows:
- Sessions (current, peak and total)
- Processes (current, peak and total)
- Messages processed (client and server)
- Run time (total and last accessed)
- As the WebApp is put under load, this information will help a developer to tune performance and also determine if the system needs to be scaled up to more than one application processor.
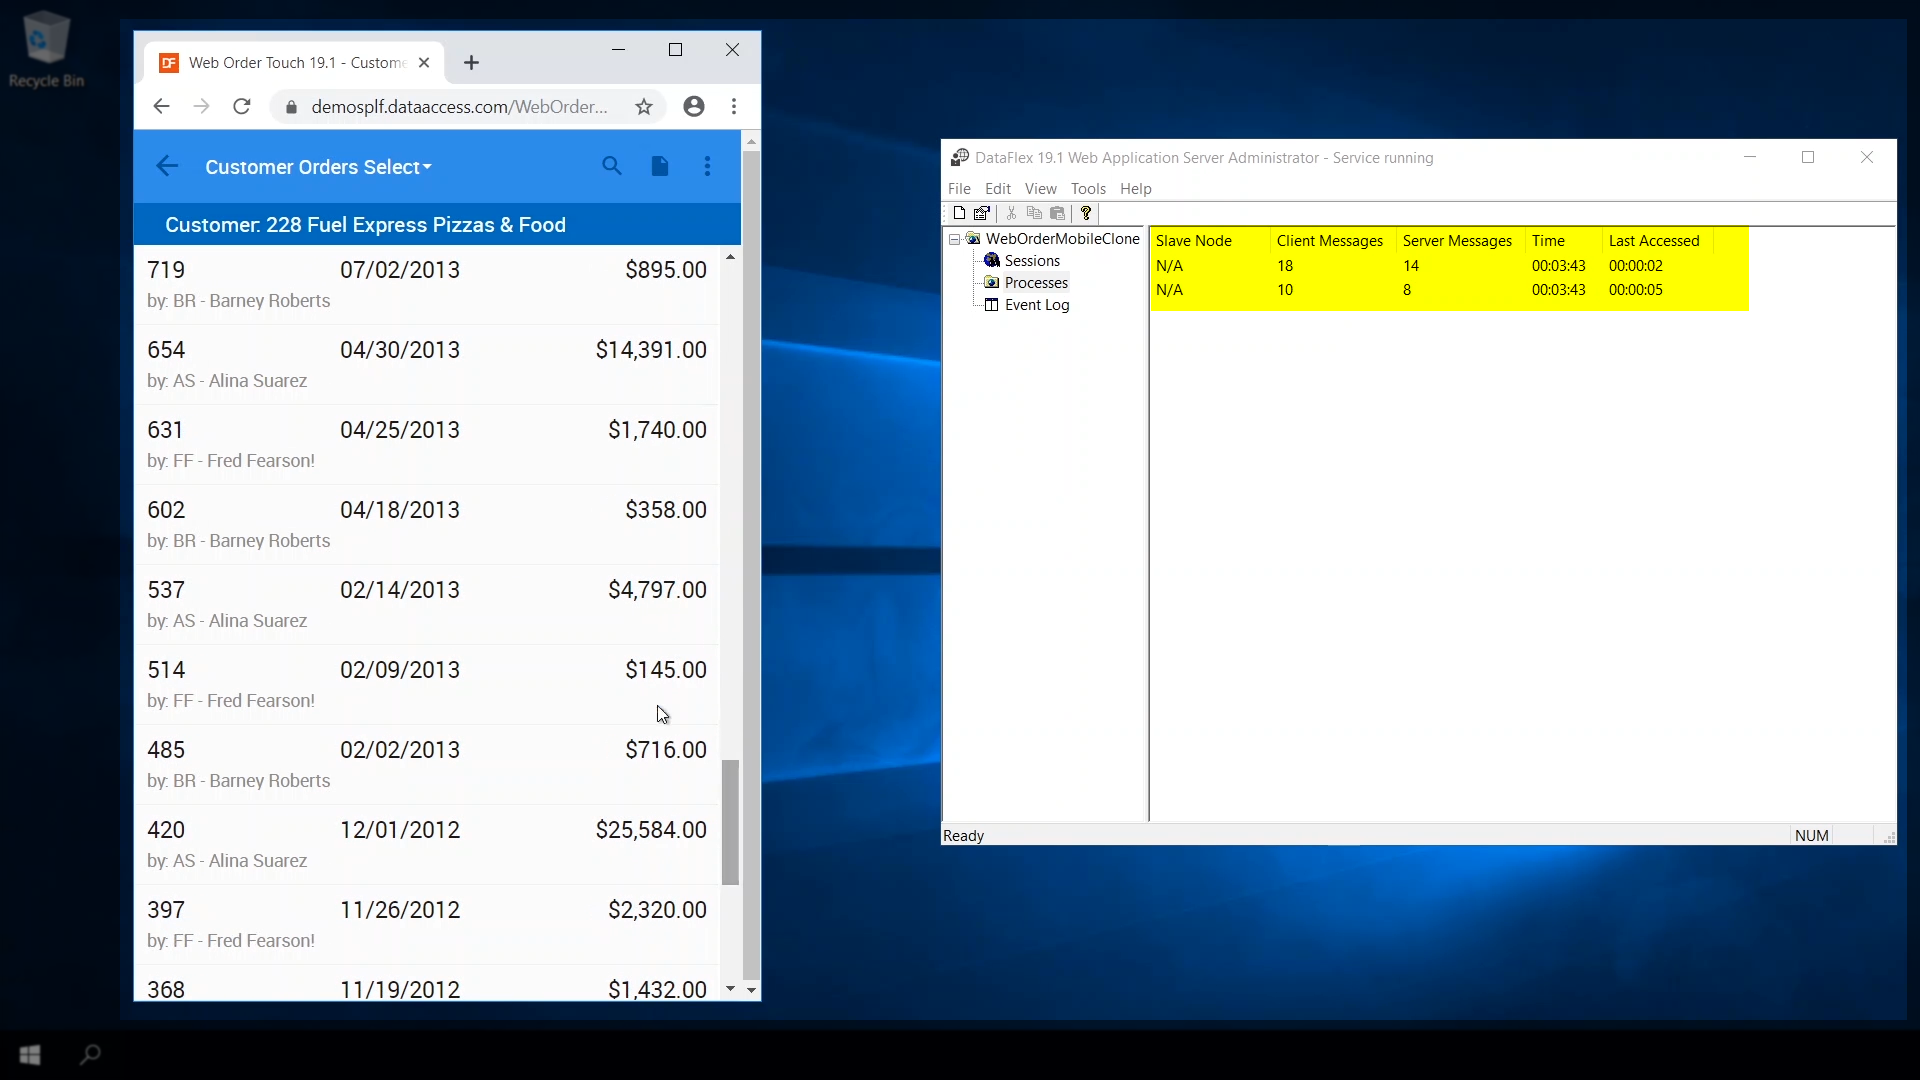
- To see how requests are handled, view the processes for the WebApp…
- As the browser loads the WebApp, the first requests are made and handled by the first available process. As each subsequent request comes in, the server assigns it to an available process. Both processes in the pool are handling requests. With one user, however, the application is not under a heavy load.
- After a few operations, the metrics show that one session was never exceeded, and the number of processes never exceeded the minimum pool of two.
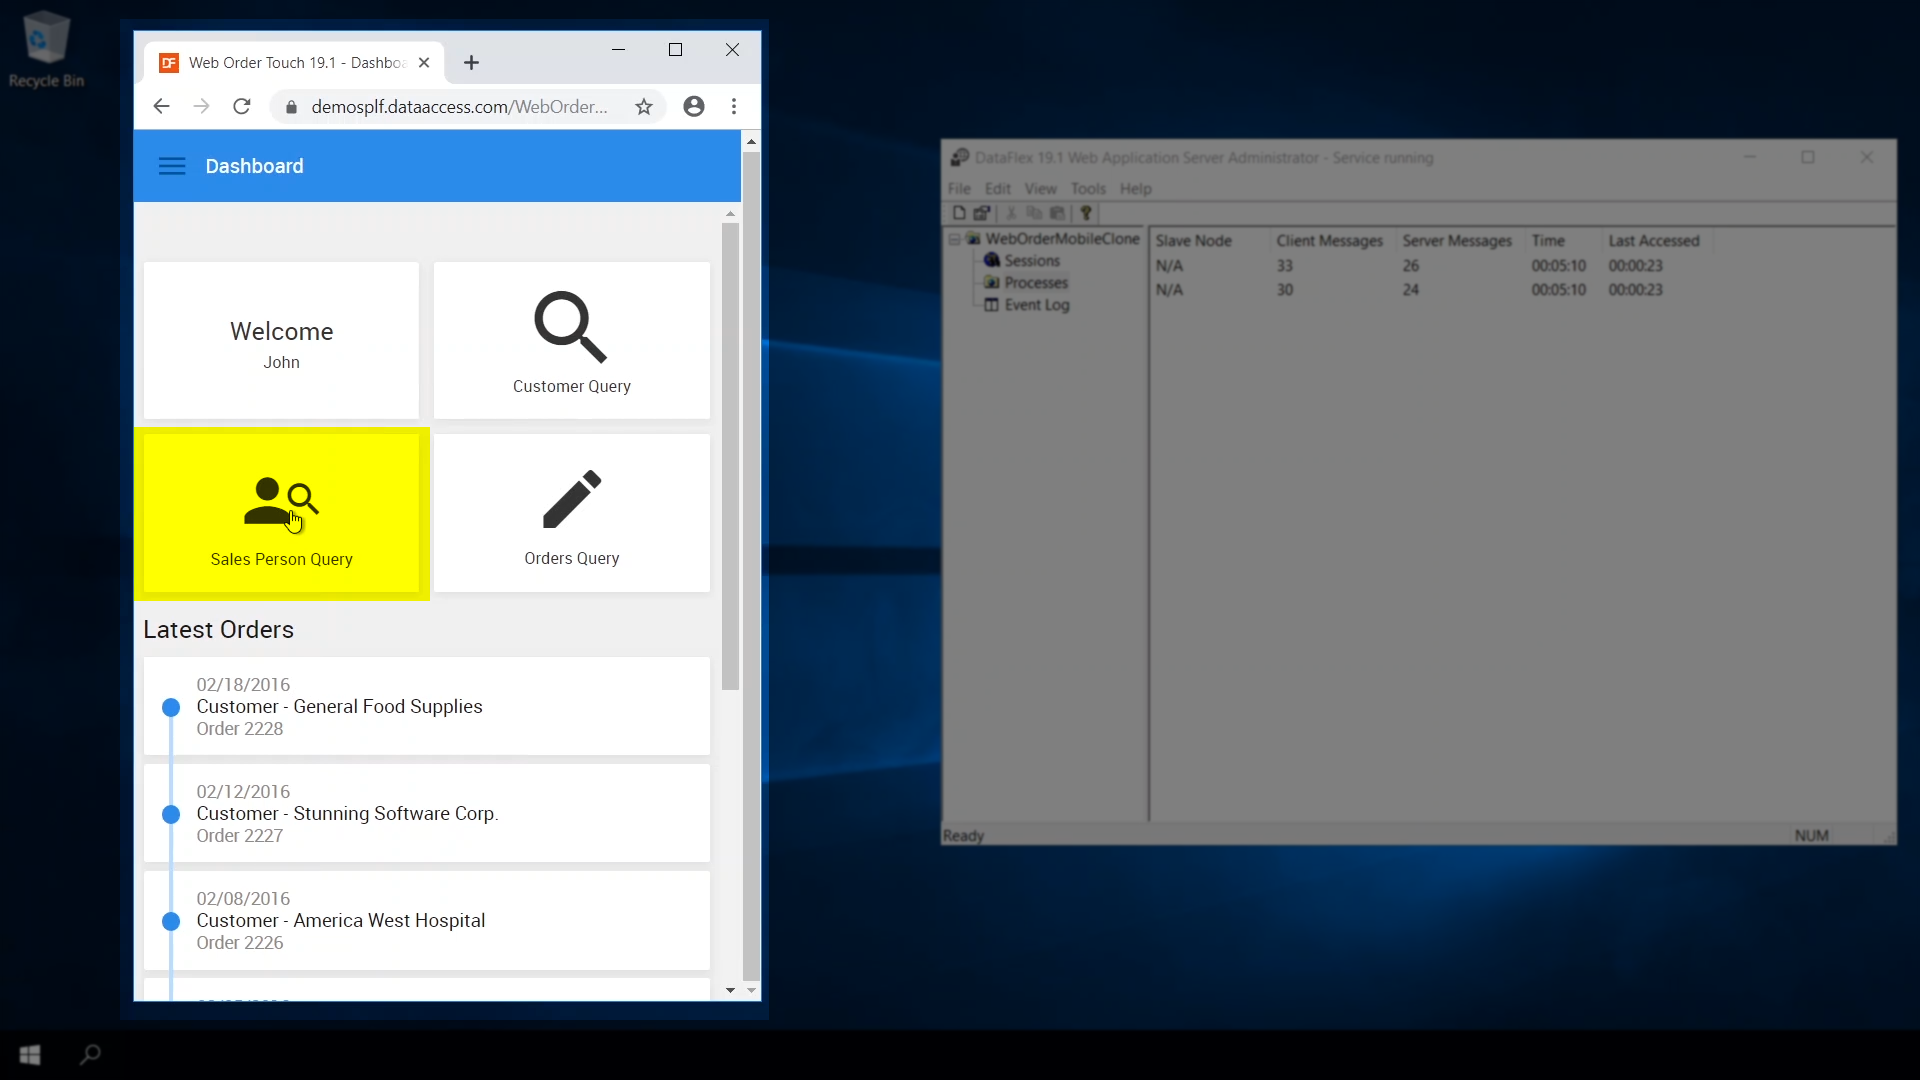
- With more users the overall load will increase. Depending on the timing of each request and the time it takes the server to respond, additional processes may be needed to handle the load.
- As long as the max pool setting has not been exceeded, the server will start up additional processes and then remove them when the peak load has passed. The max pool setting is set to four.
- To show what happens when the number of running processes is not sufficient to handle a peak load…
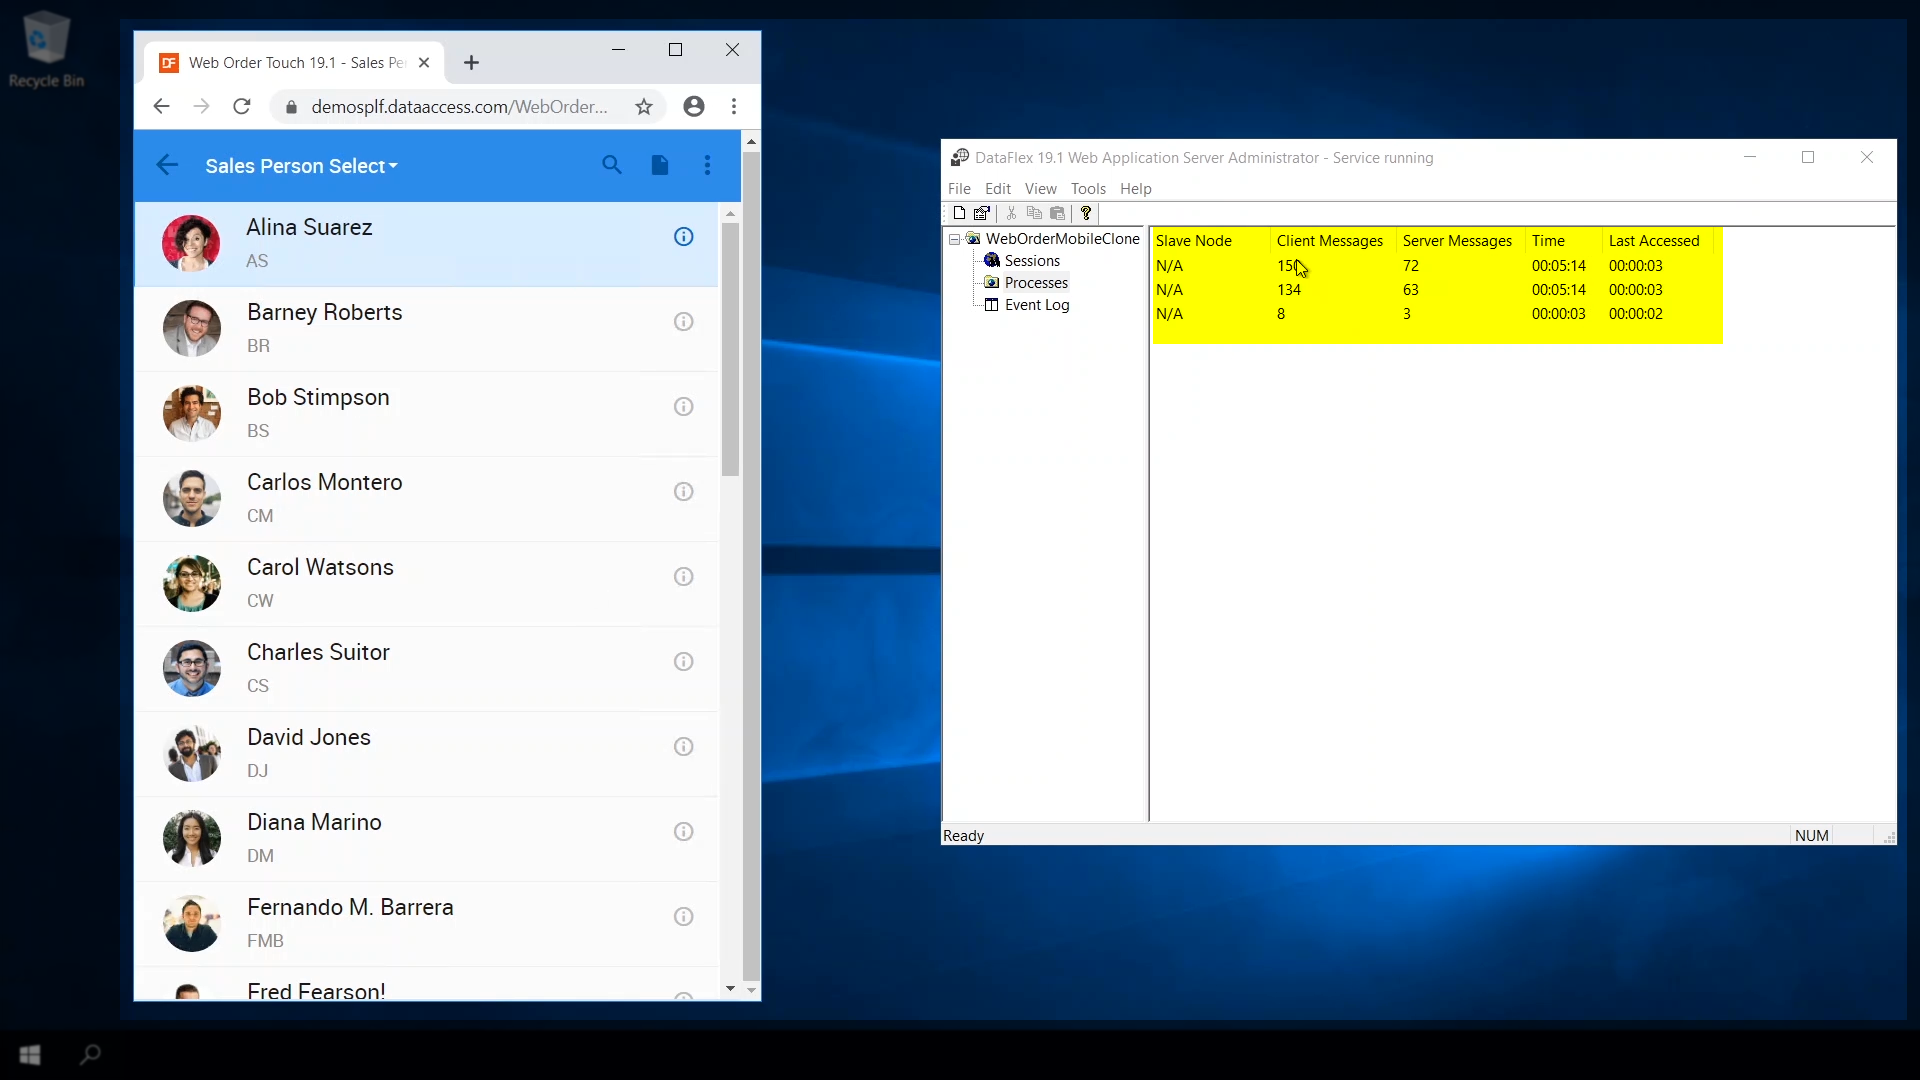
- Navigate to the Sales Person Query in our WebApp.
- The act of loading all the sales person avatars forces a temporary peak. This causes the server to start a third process to handle that load. If the additional load on the application server is halted it will eventually remove that additional process to get back down to the minimum pool size.
- How to determine what the optimal settings for the process pool are…
- View the metrics for the WebApp in the Administrator. The key to making the determination is to look at the peak processes and total processes. The peak tells indicates how many processes are needed under maximum load, and the total number expresses how many times additional processes were needed.
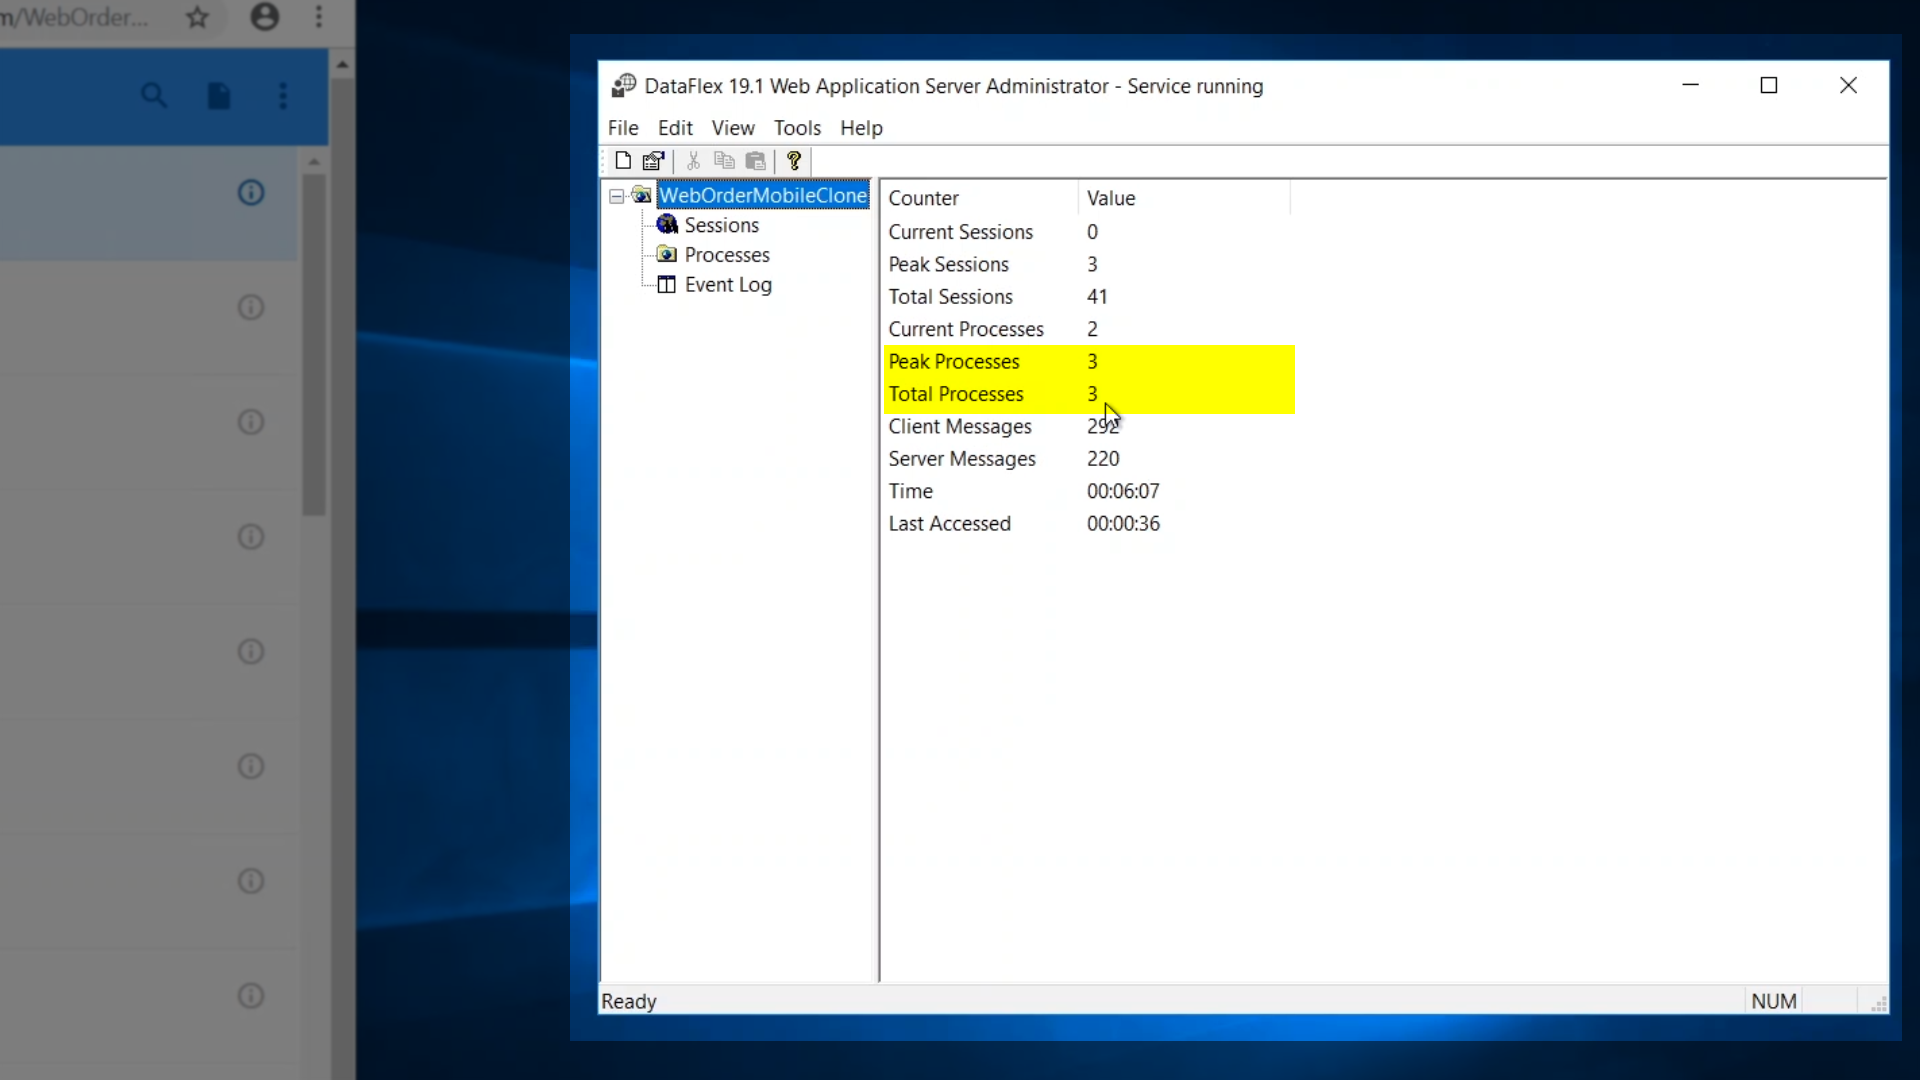
- In this basic example, the peak and total were both three, so the peak was only slightly higher than the minimum pool setting and only happened once during the observation period. In this case, no further adjustments are needed.
- If the total processes had been 10, that would mean that the peak of three was hit eight times during the observation period, and the best course of action would be to set the minimum pool setting to three because it hit that peak too many times in such a short period of time.
- During the testing phase of development, put applications under load (either simulated or with users participating in the test) to help determine the best initial settings for the process pool.


