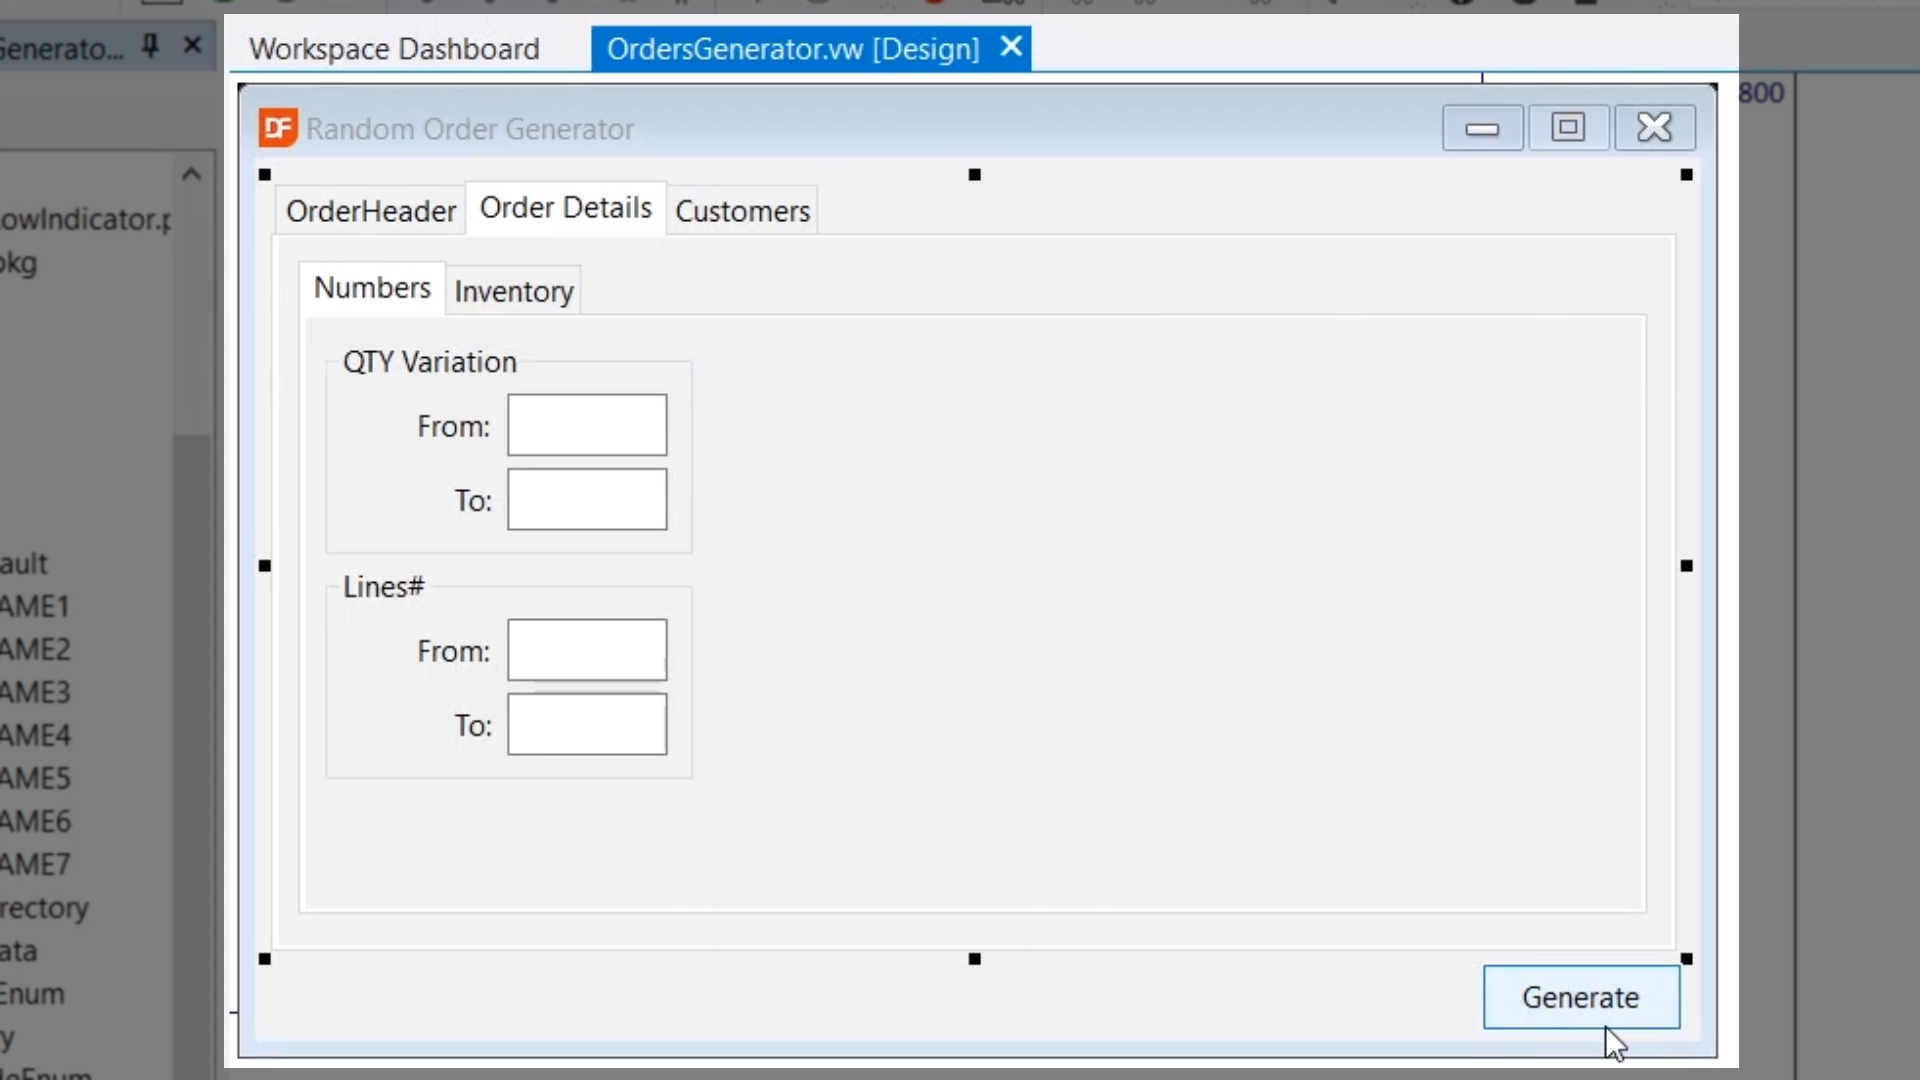
Debugging techniques will be shown by inspecting the code for the ‘Generate’ button that is part of the ‘OrderGenerator.vw’ view.
Double click on the ‘Generate’ button to open the Code Editor to that object
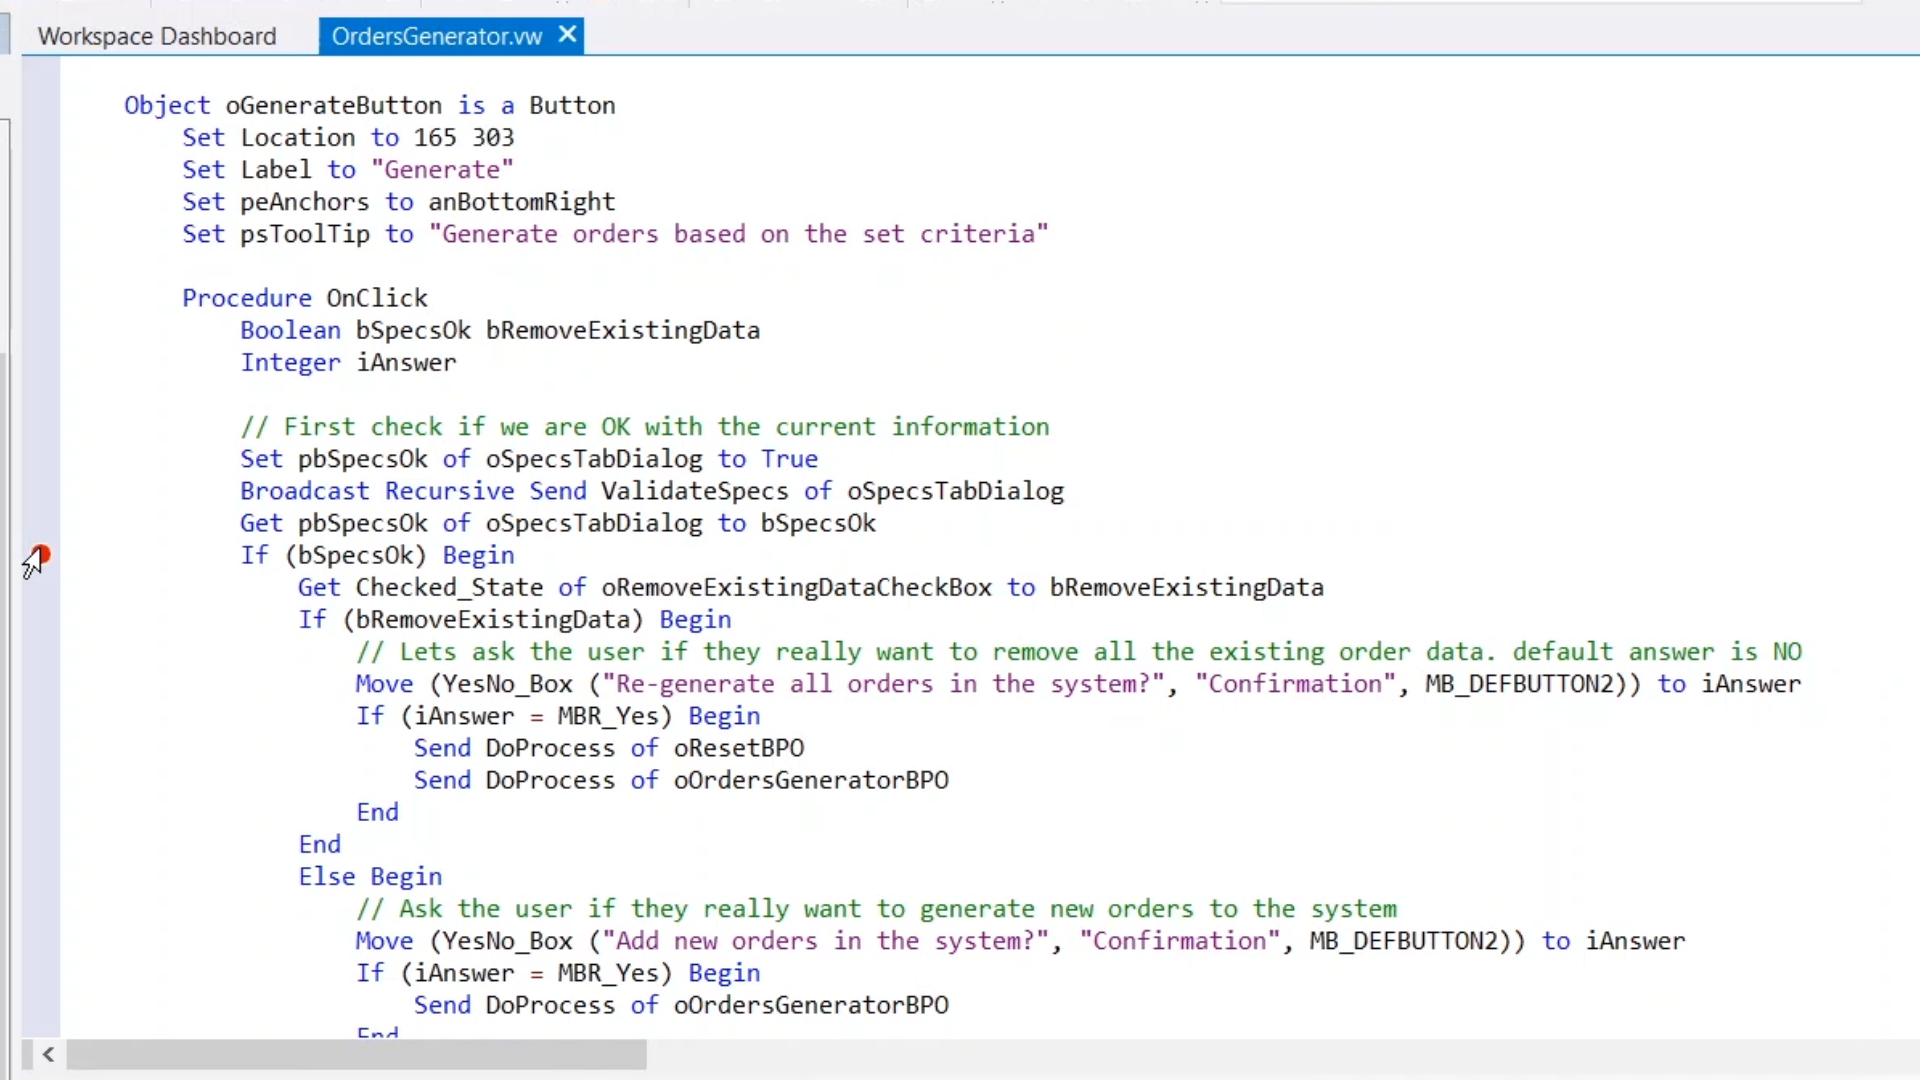
Clicking in the left margin of the Code Editor places a breakpoint
Apply a breakpoint at the line If (bSpecs0k) Begin
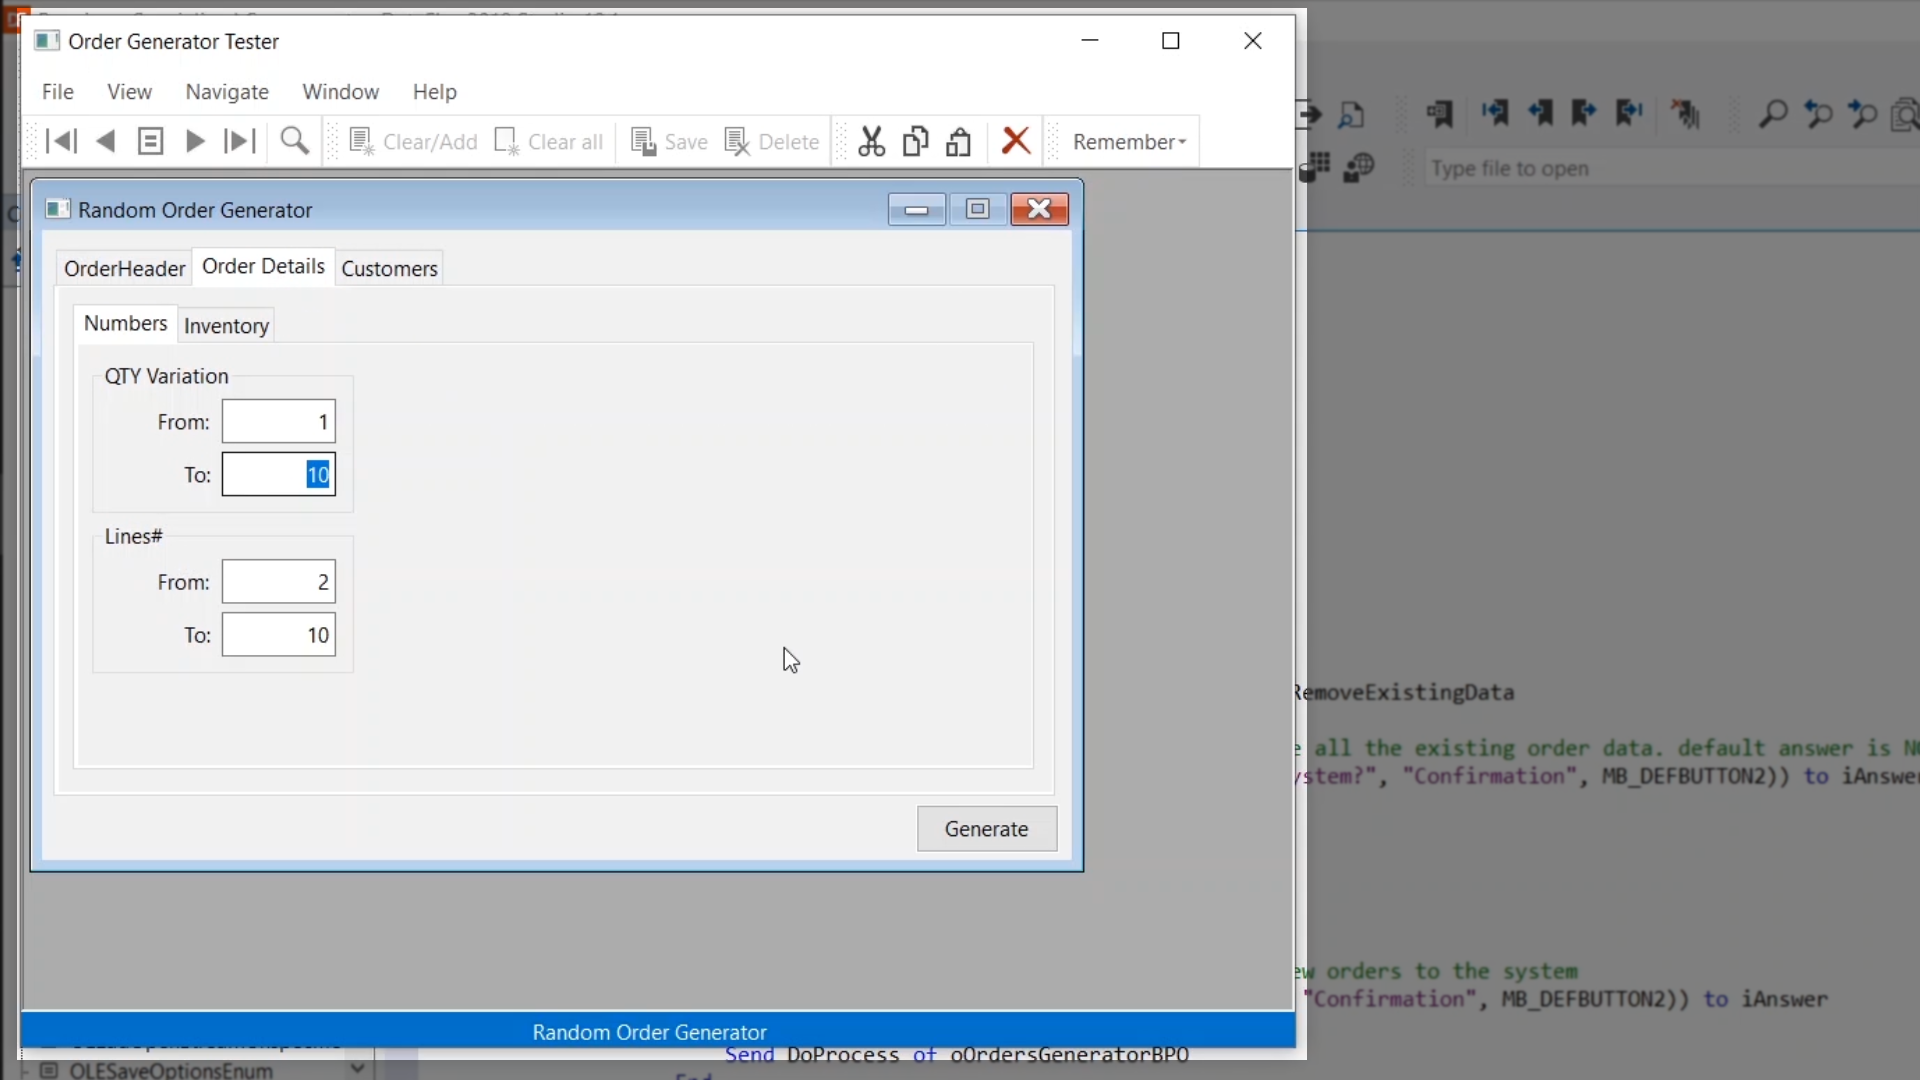
Click the Run icon from the top menu bar to run and compile the program
The Studio will compile the program if there are code changes, and then run in debug mode
Click on the ‘Generate’ button in the running program
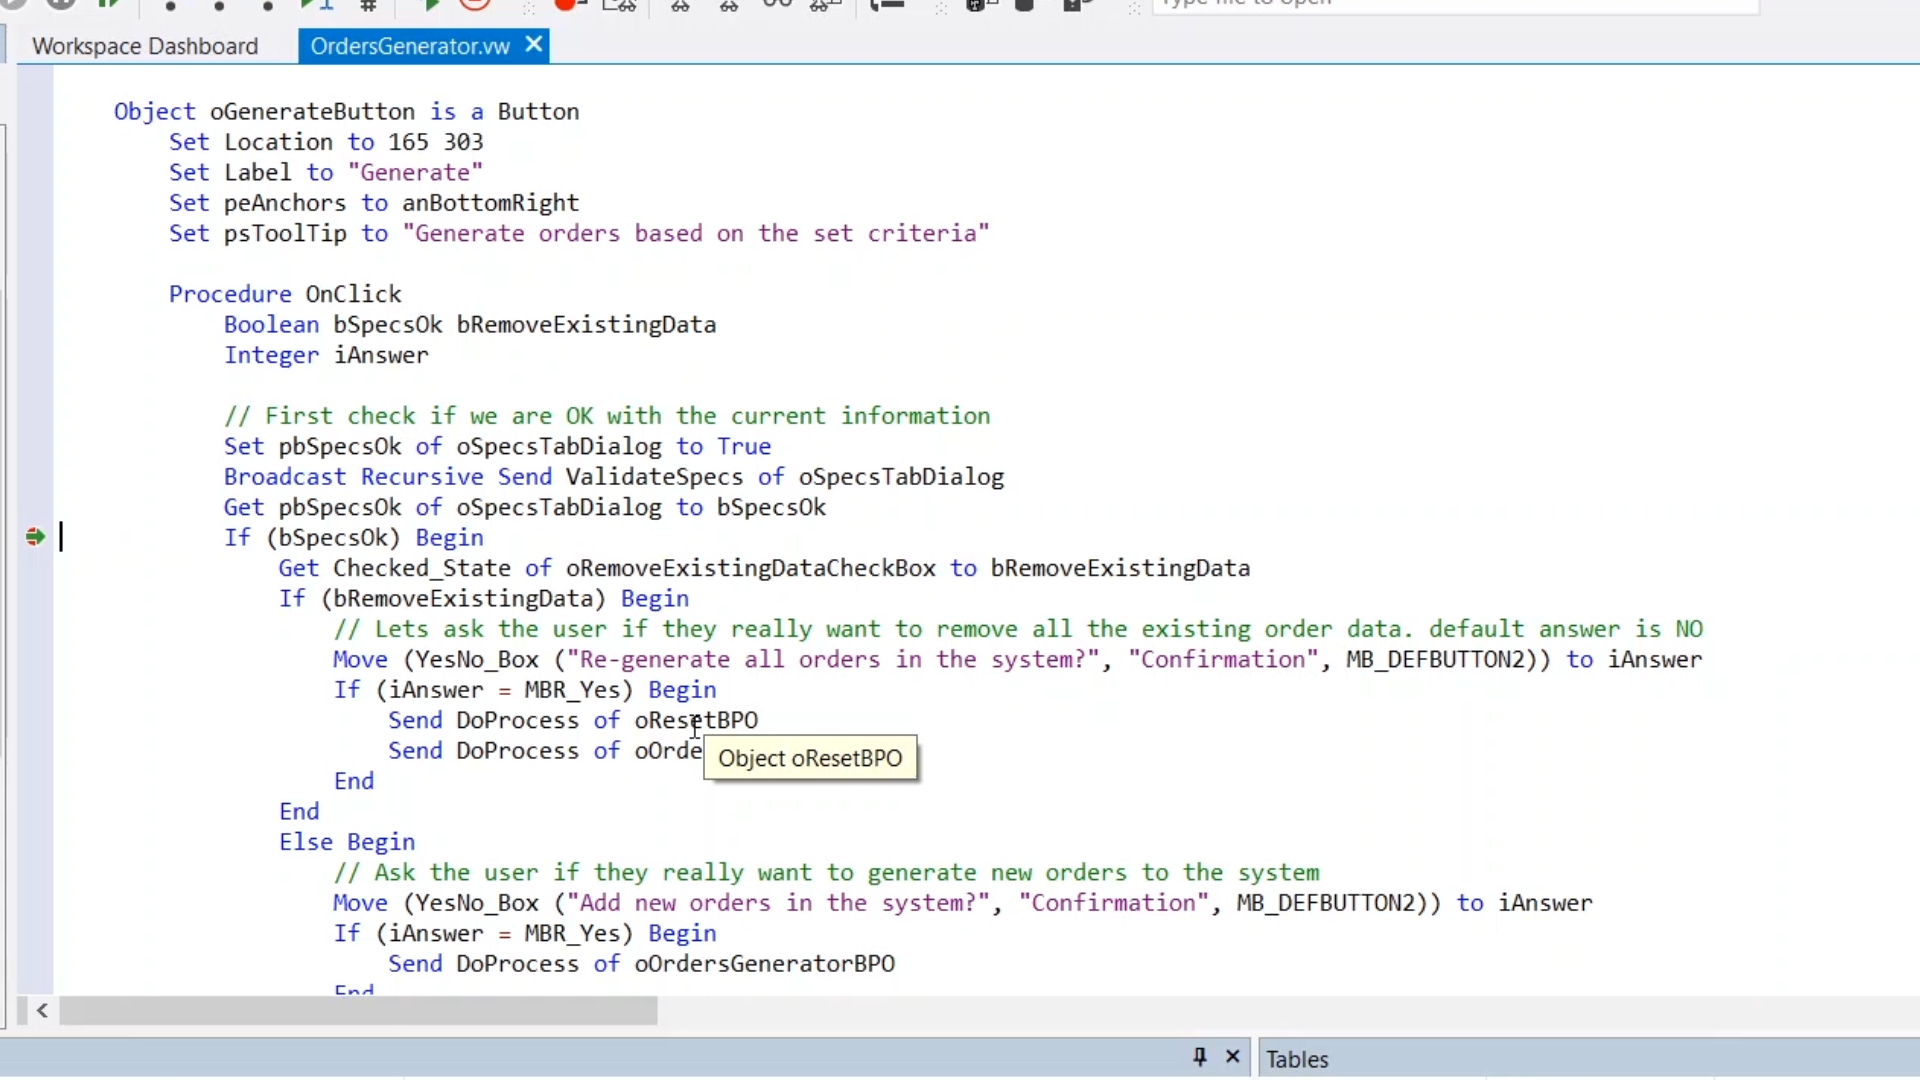
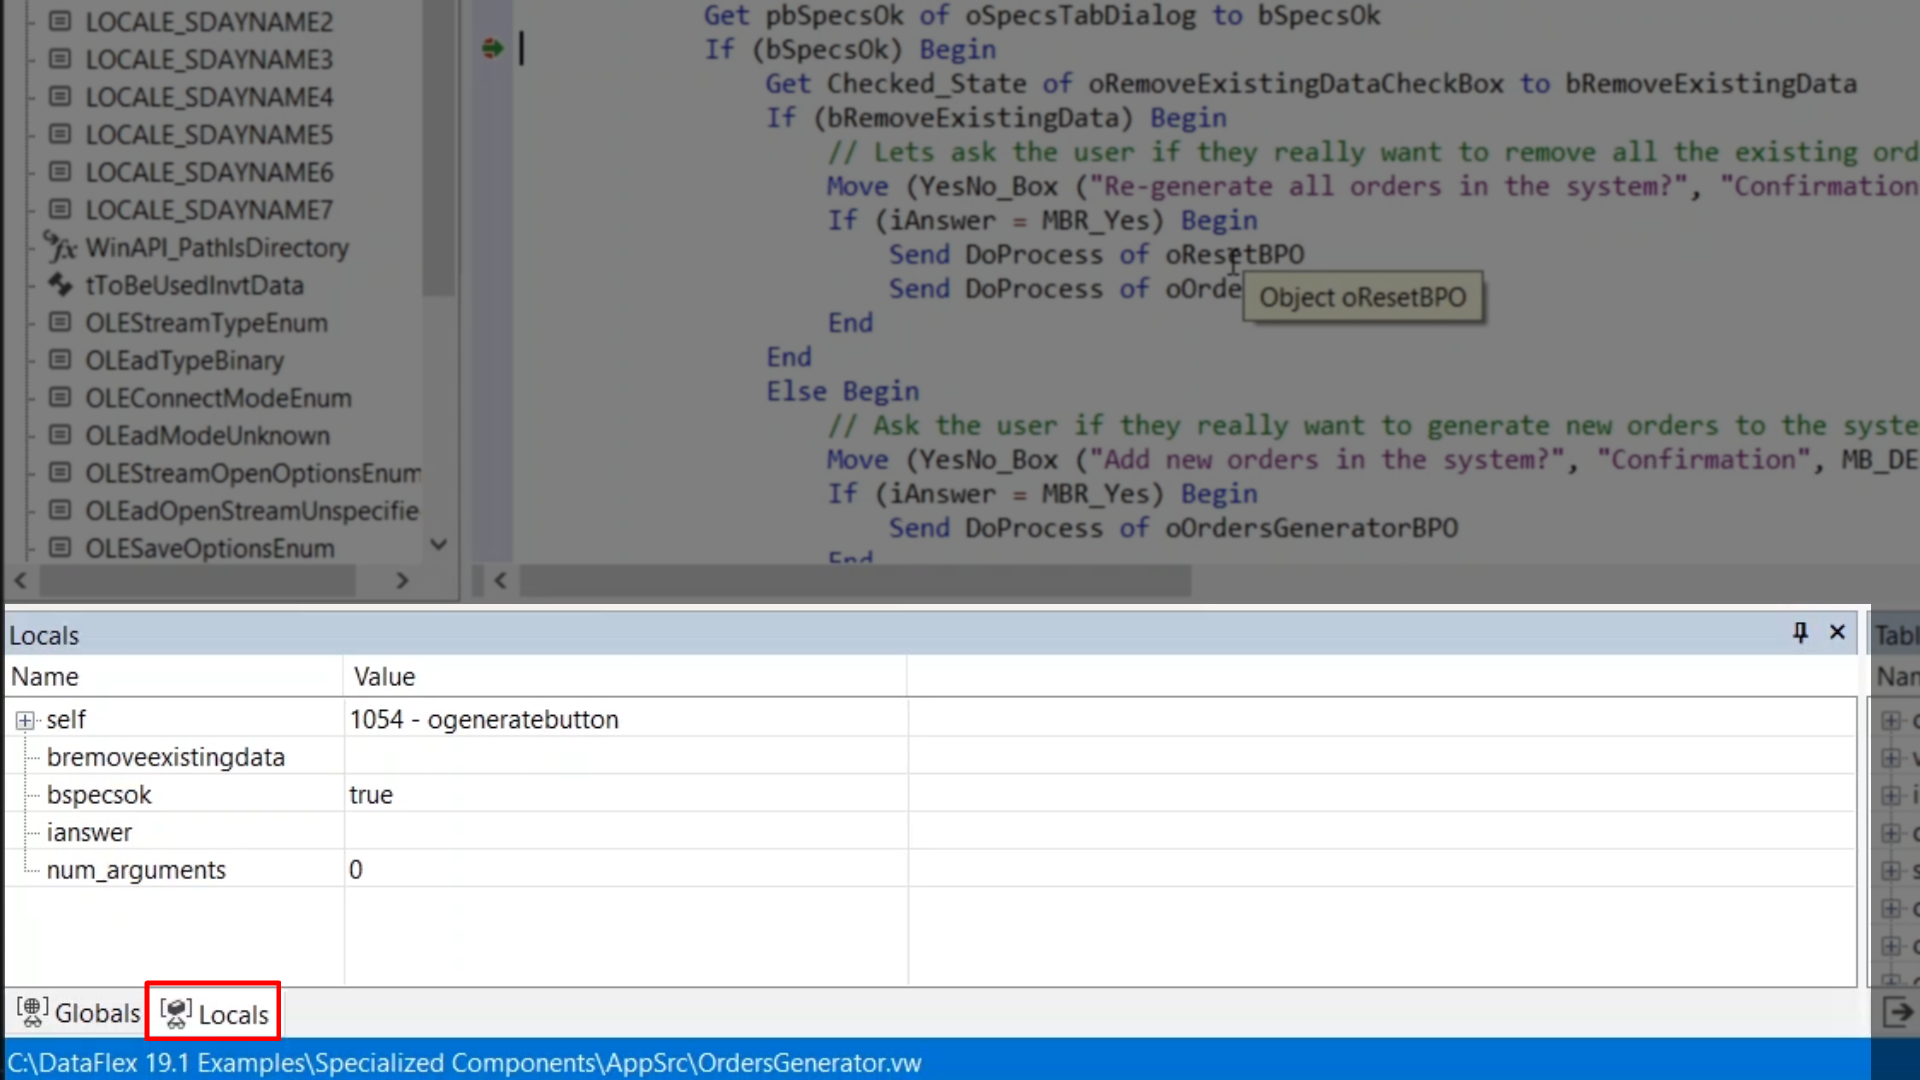
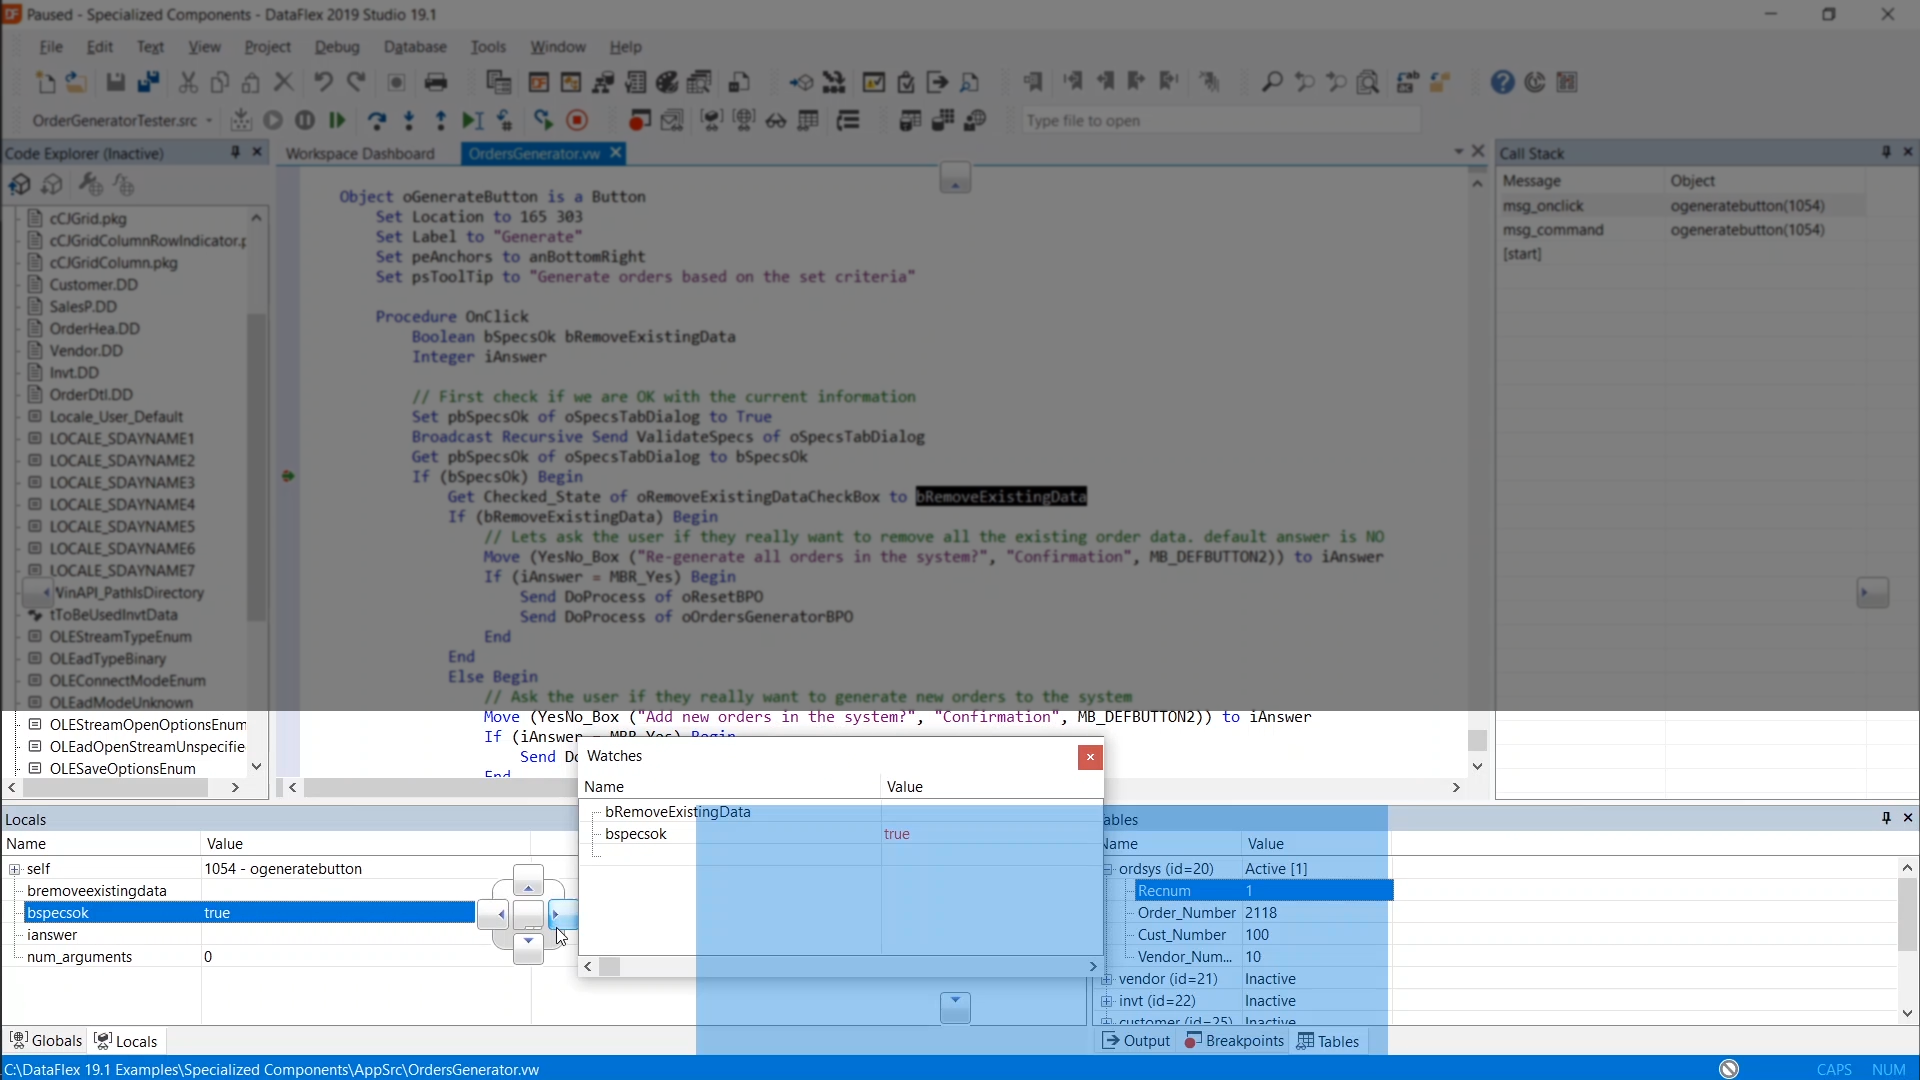
The code shows that the program has stopped where the breakpoint was placed
The ‘Locals’ window at the bottom of the Studio shows all of the local variables and the current method listed
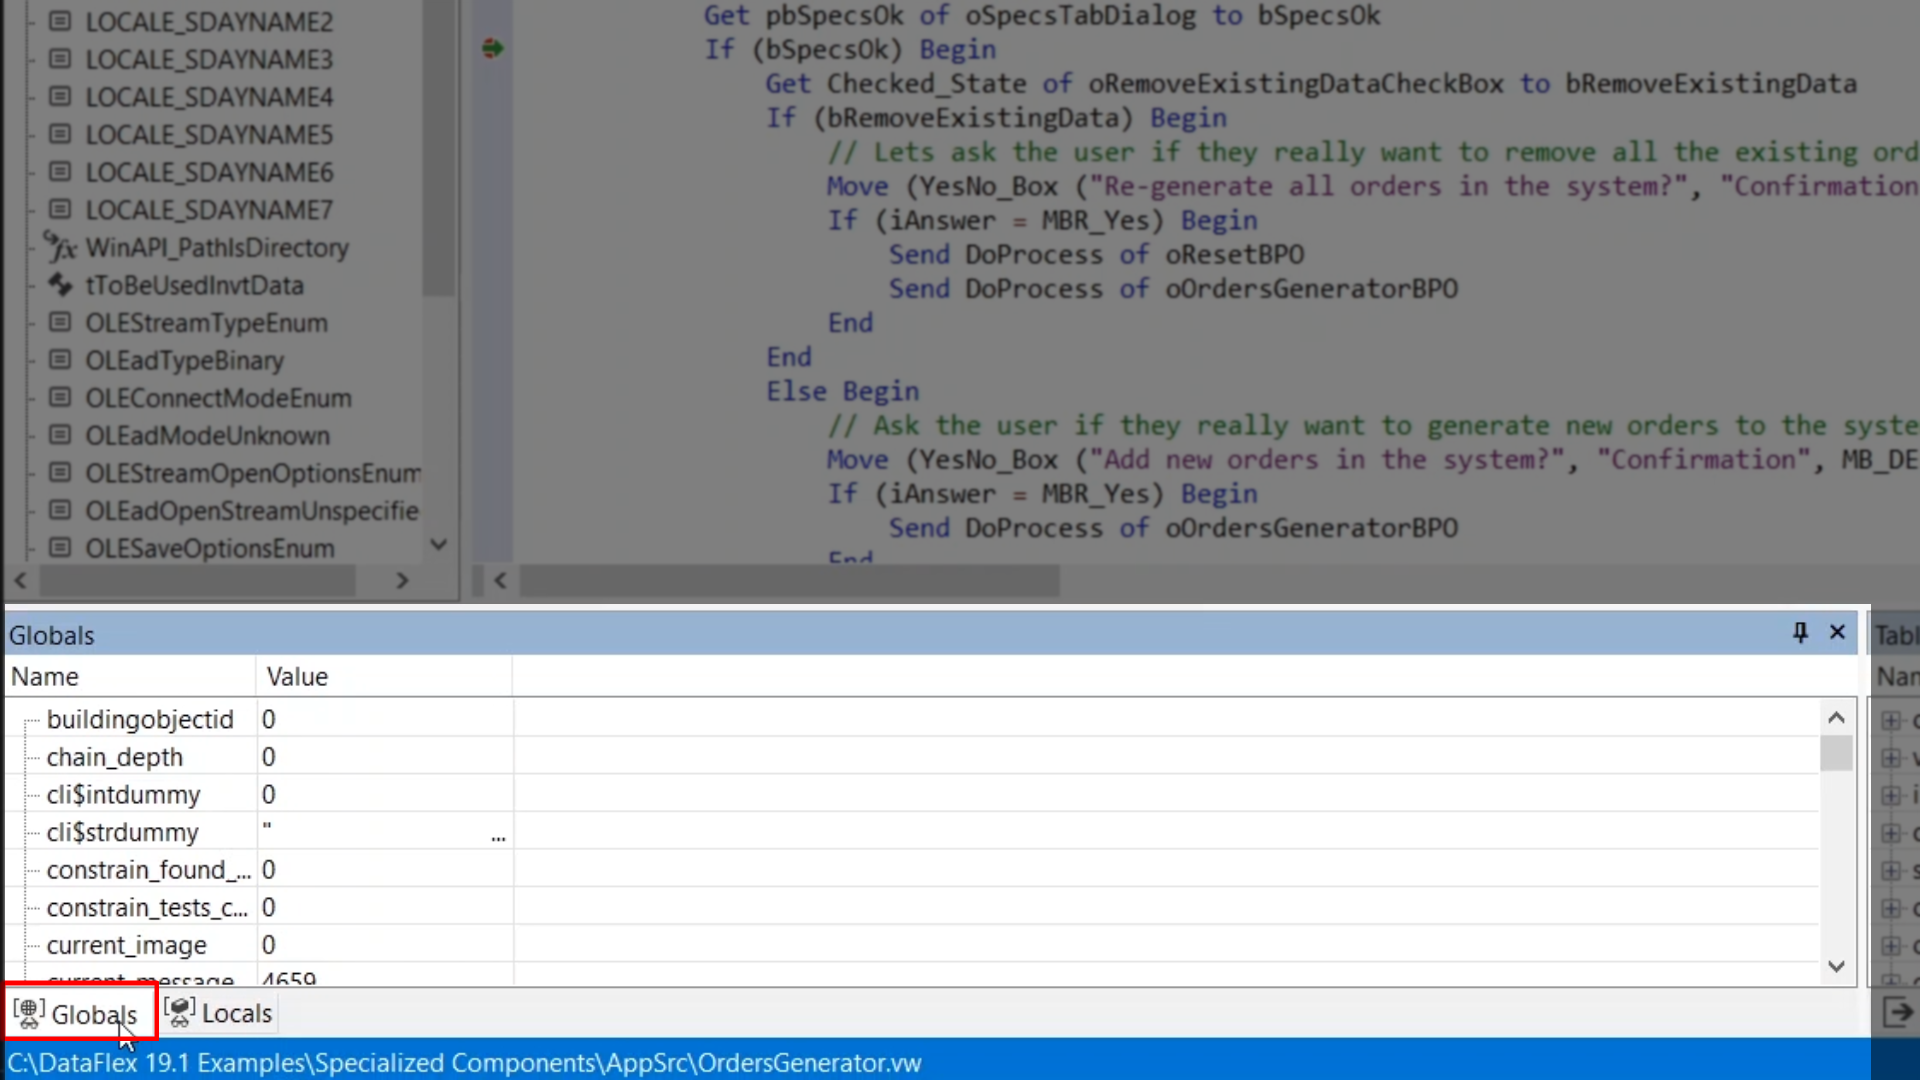
The ‘Globals’ window shows all of the predefined variables from the DataFlex packages. These are rarely used.
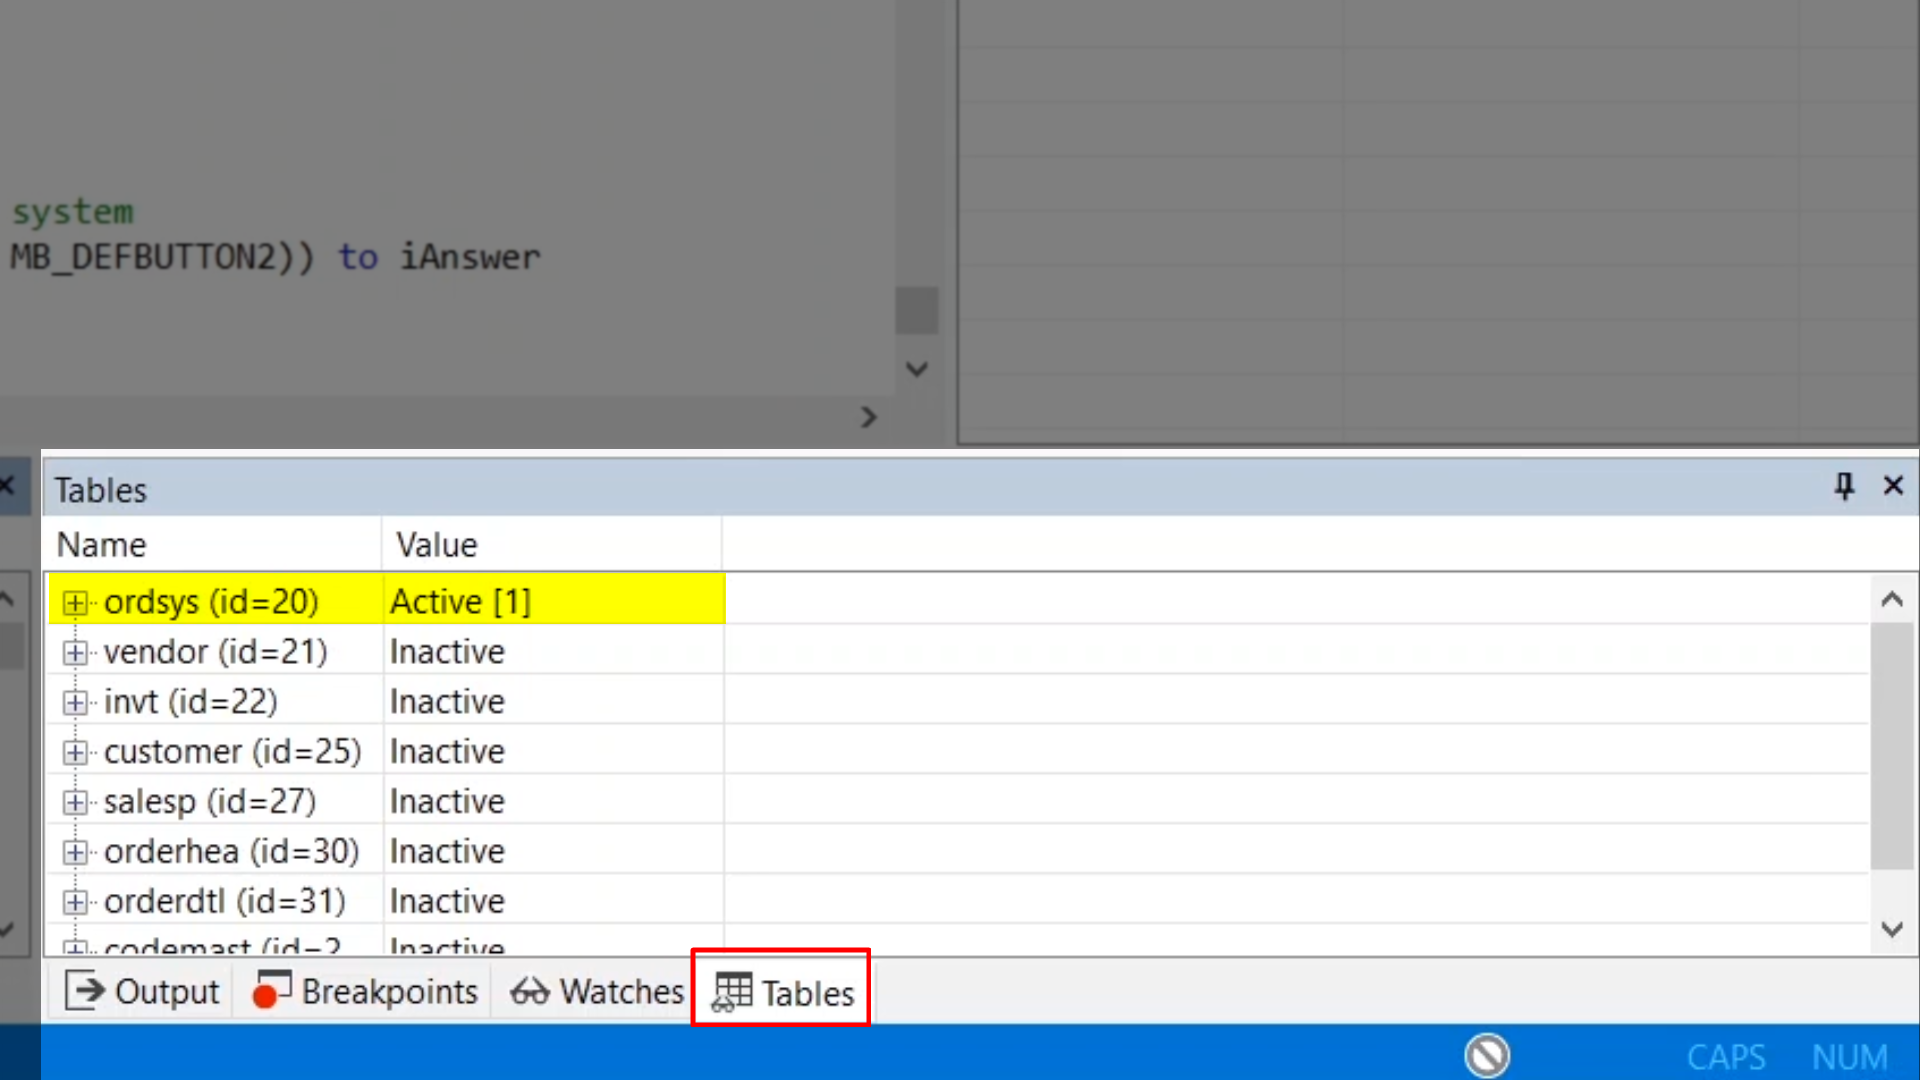
The ‘Tables’ window lists all of the currently opened tables in the program
Currently, ‘ordsys’ is the only active table. The is because it is a system table, and system tables always have their one and only row loaded in the global table buffer.
The remaining tables show as inactive because no rows have been found within them.
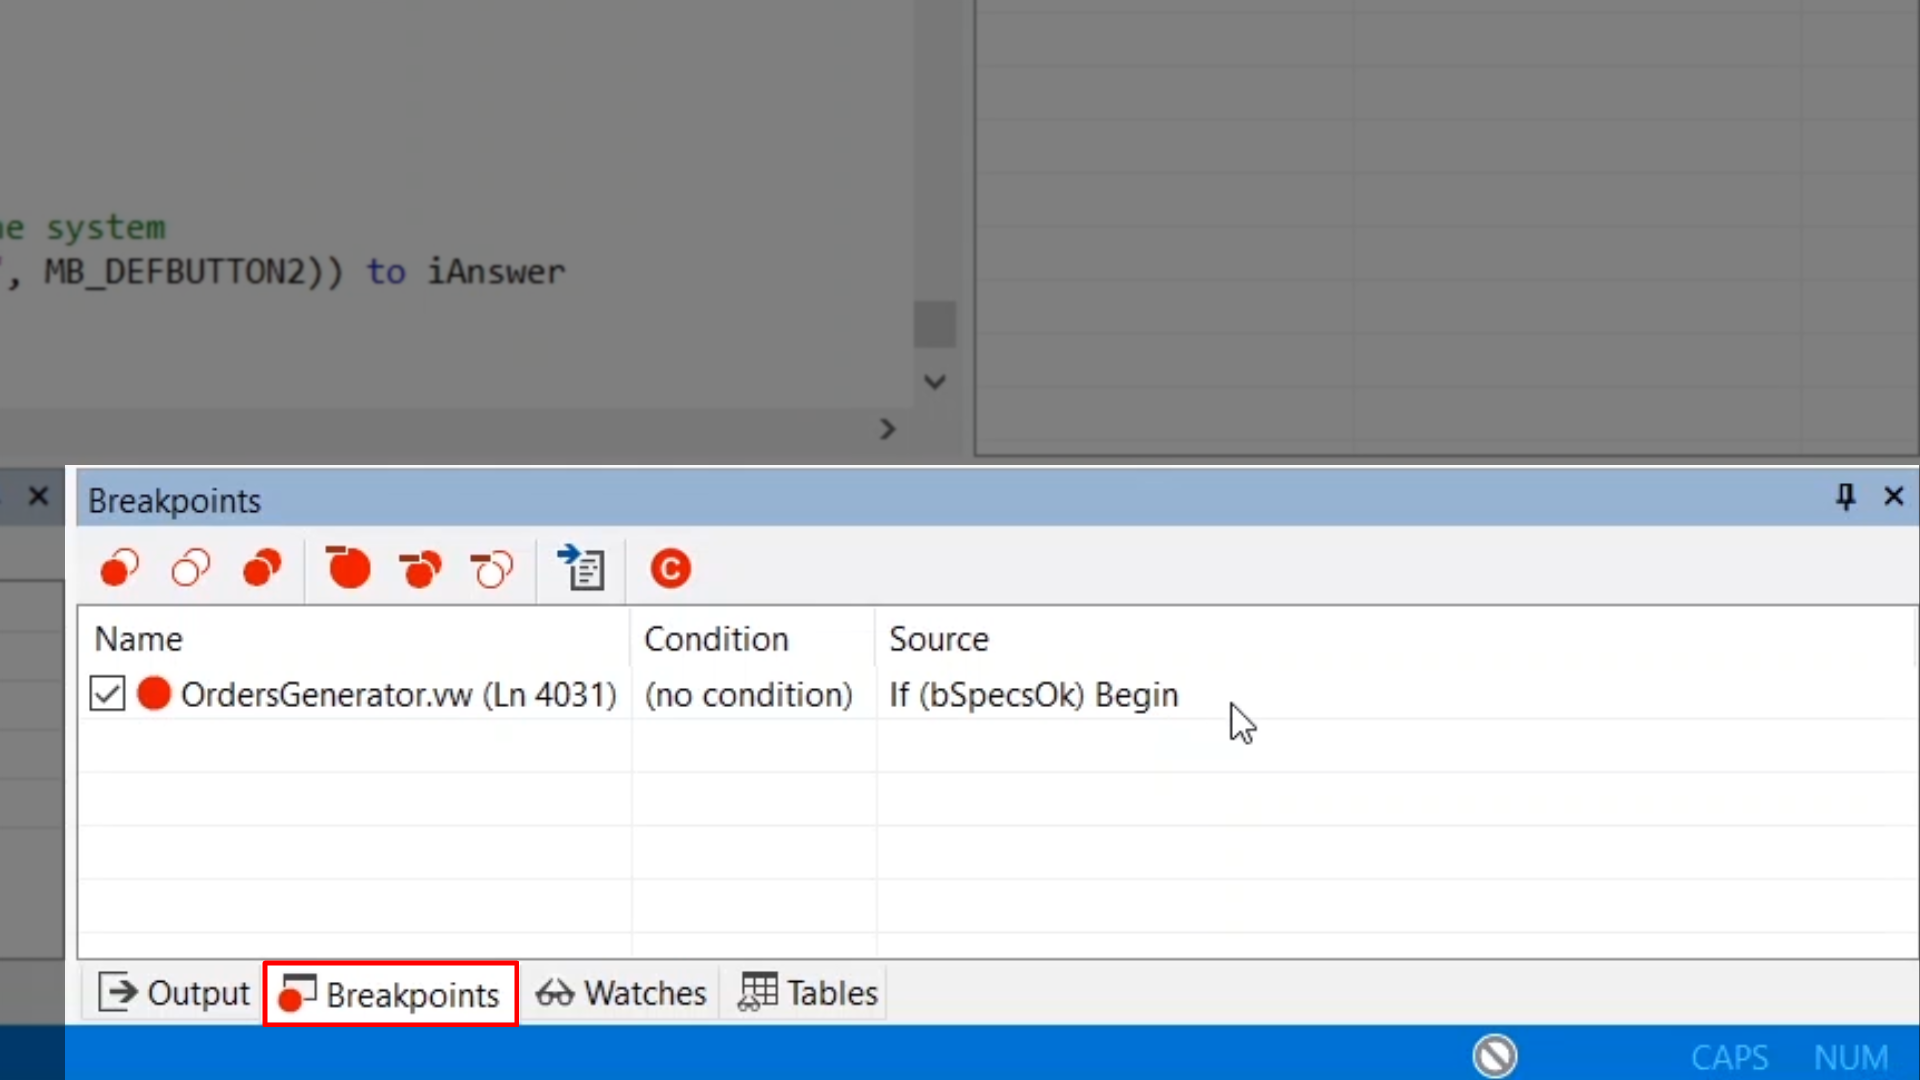
The ‘Breakpoints’ table shows the single breakpoint that was added
The icon shows red to indicate that it is enabled. The window also shows which file and line of code the breakpoint was added to, and that no conditions have been added to it.
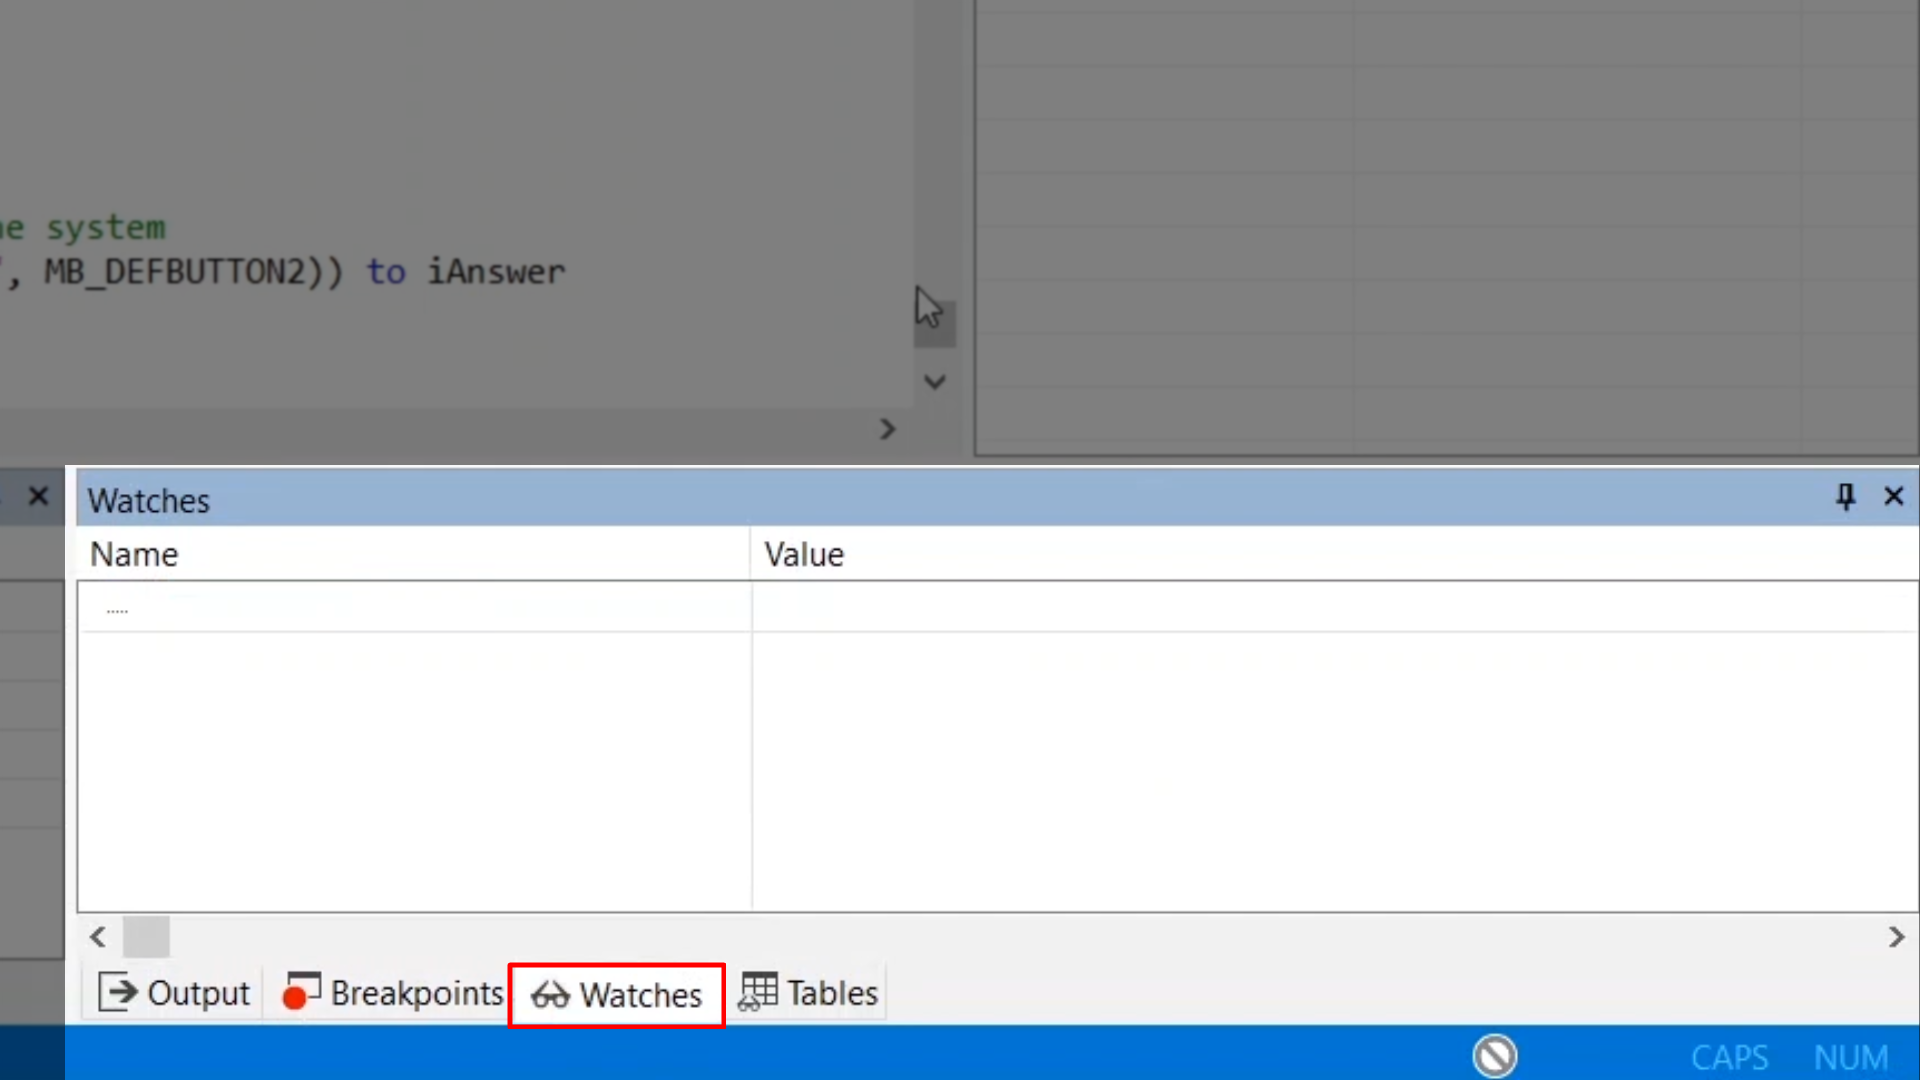
The ‘Watches’ window is currently empty but is an extremely valuable resource within the debugger because custom watches can be added to Locals and Globals tables and even custom expressions. This allows a developer to only focus on what is important to them while debugging without the clutter of all the other windows.
Tip: To move stacked windows to be next to each other, simply click on the named tab of the window, and drag it to the desired location to pin in as a new Studio pane.
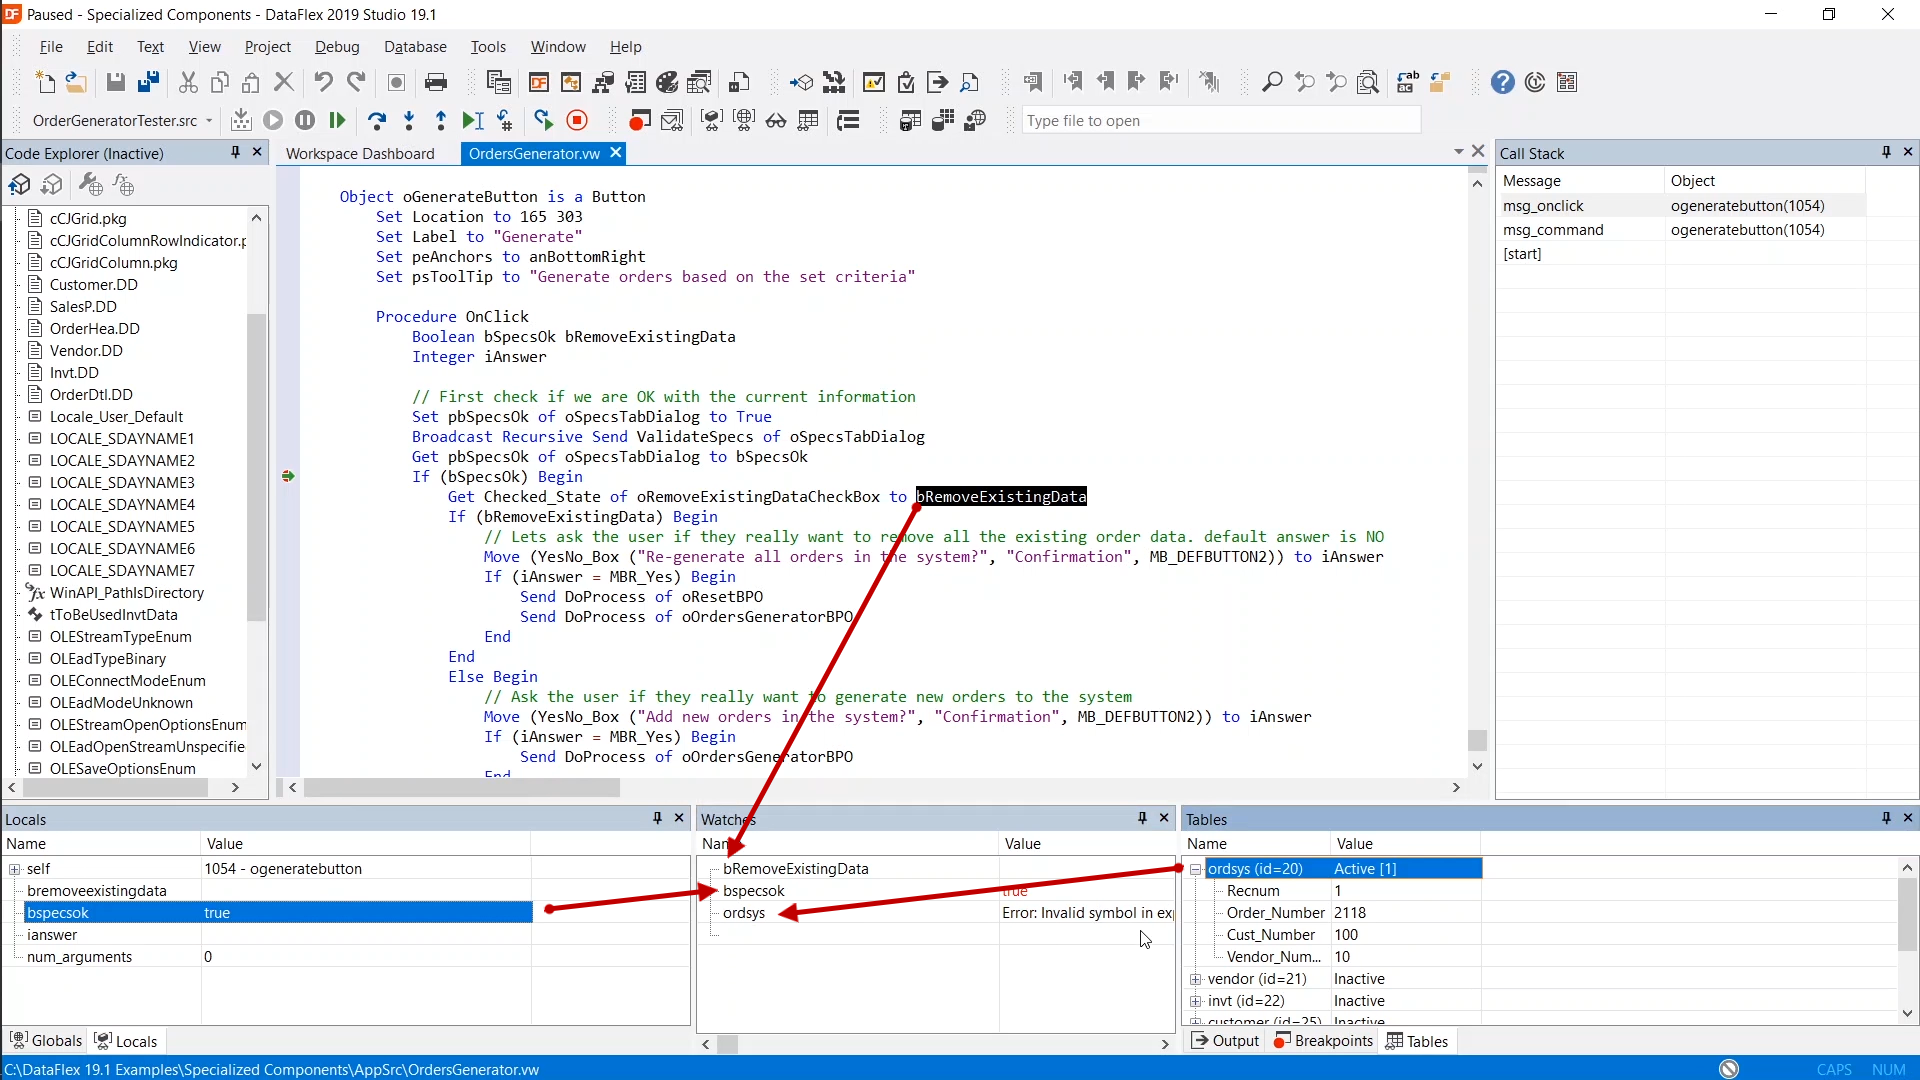
A variable can be dragged from the Code Editor, the ‘Locals’ window or the ‘Tables’ window into the ‘Watches’ window
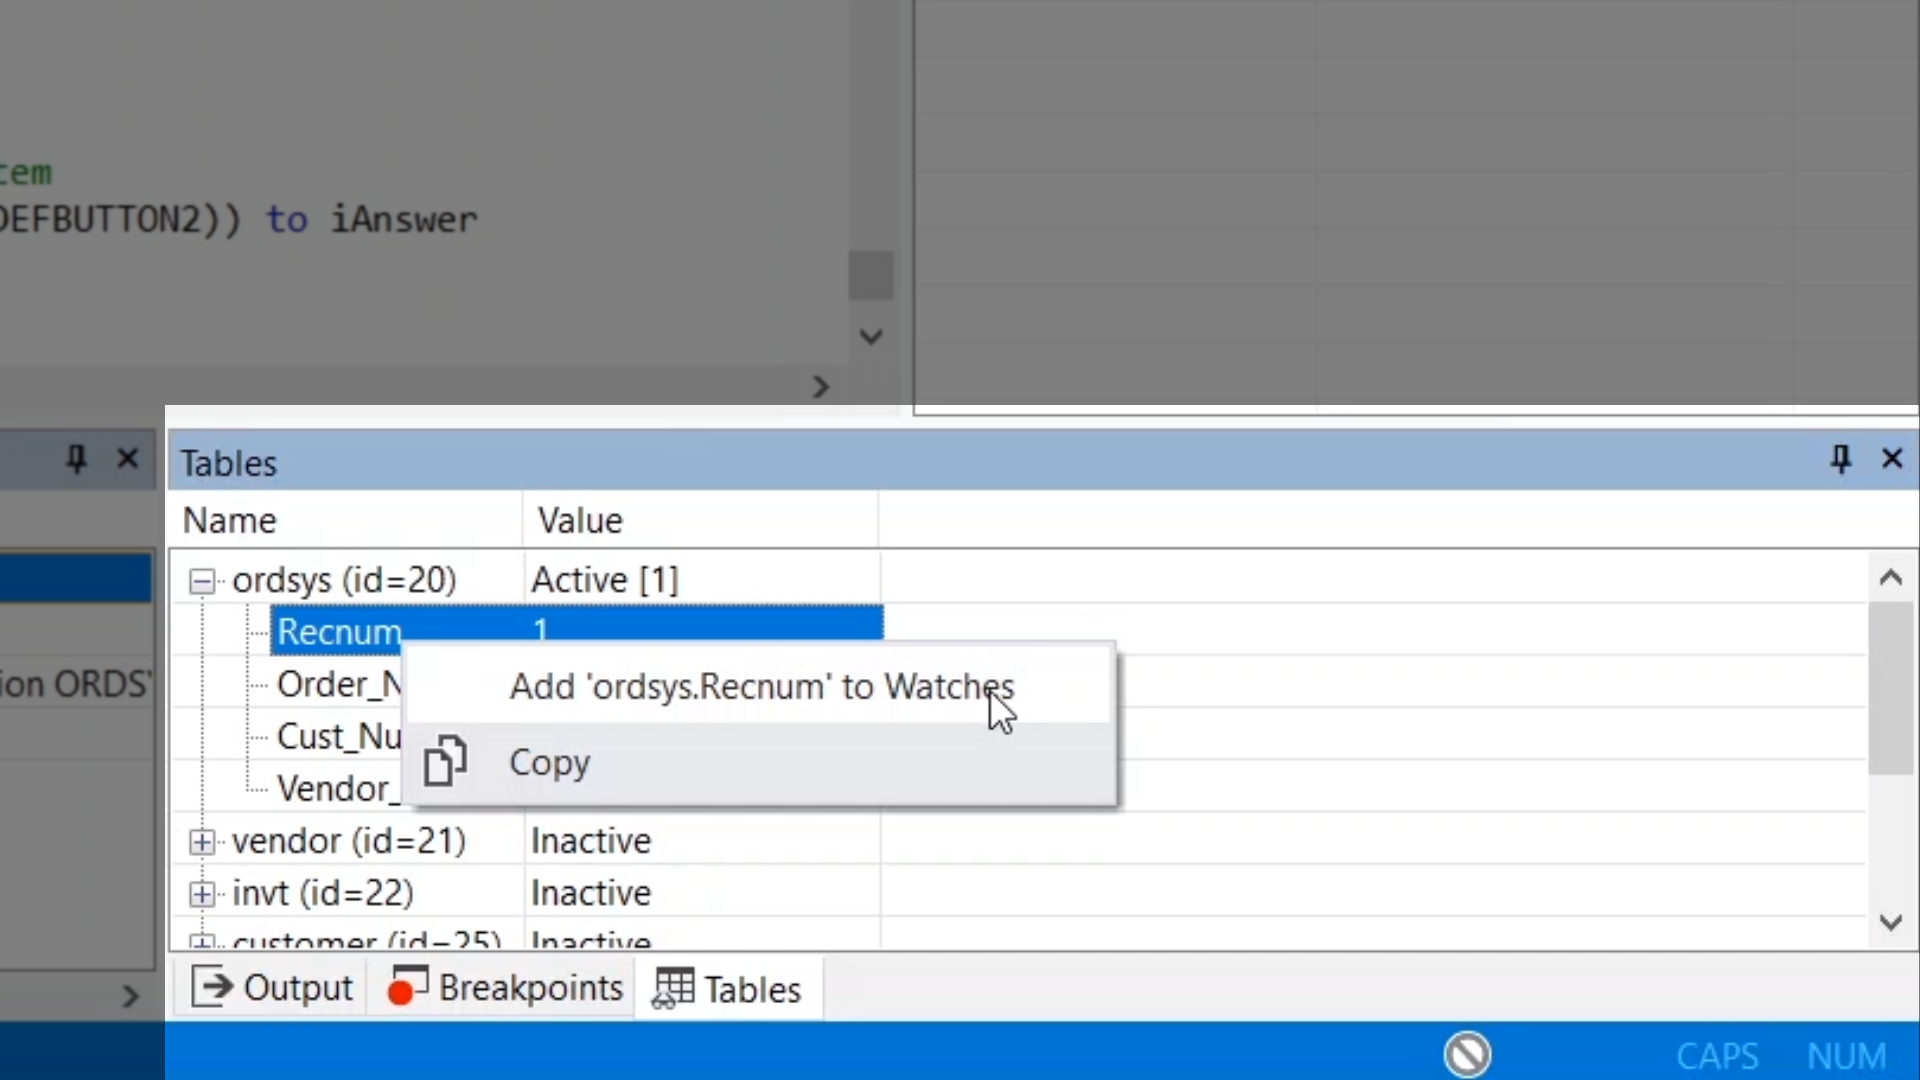
Alternatively, variables in the different windows can be right clicked, and “Add ‘variable name’ to Watches” selected to have them placed into the ‘Watches’ window
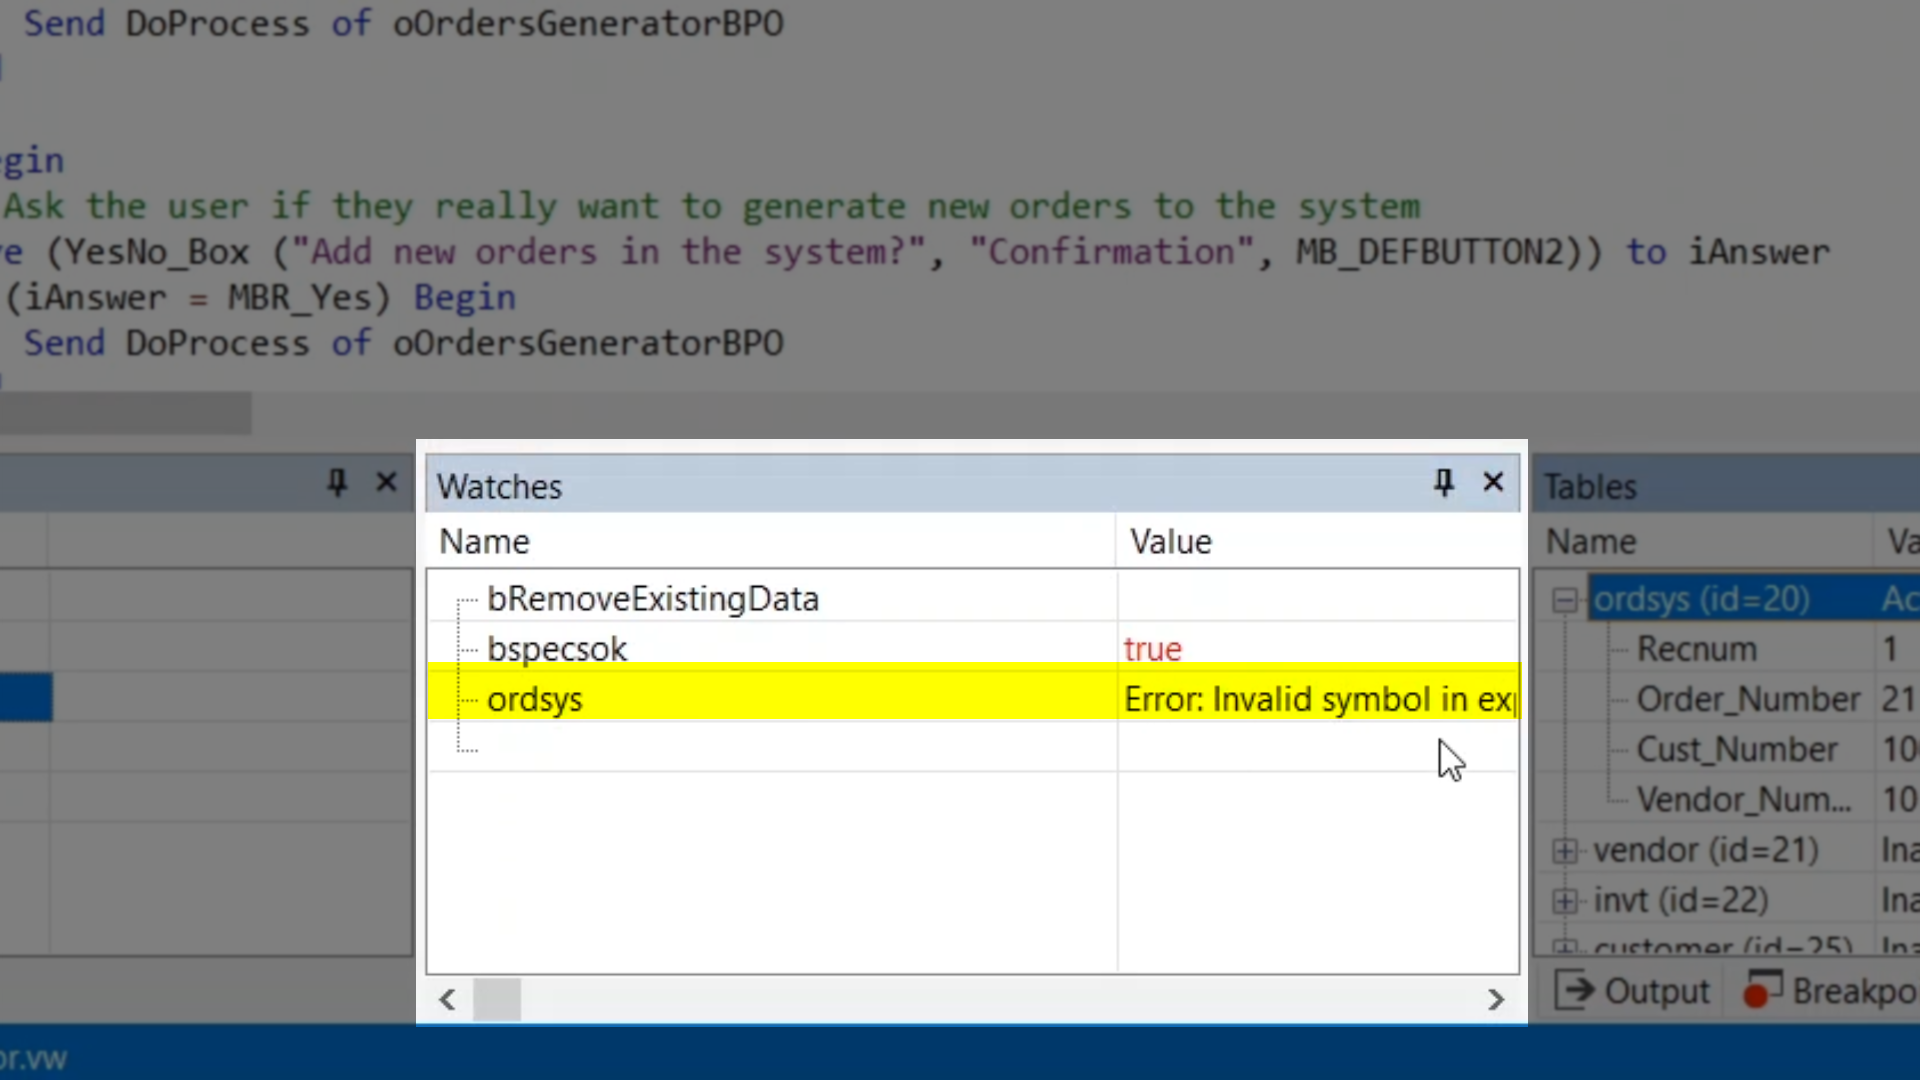
An error message will appear if a variable is added to the ‘Watches’ window that cannot be evaluated