To continue with this content, please log in with your Data Access ID or create a new account.
Cancel Data Access ID
You may not be authorized to see this content. Please contact Data Access Europe for more information.
Cancel Data Access Europe
You are not authorized to see this content.
Cancel Data Access Europe
Next lesson:
Debugging WebApps
Cancel

Debugging DataFlex Apps

Lesson 9: Message Tracing

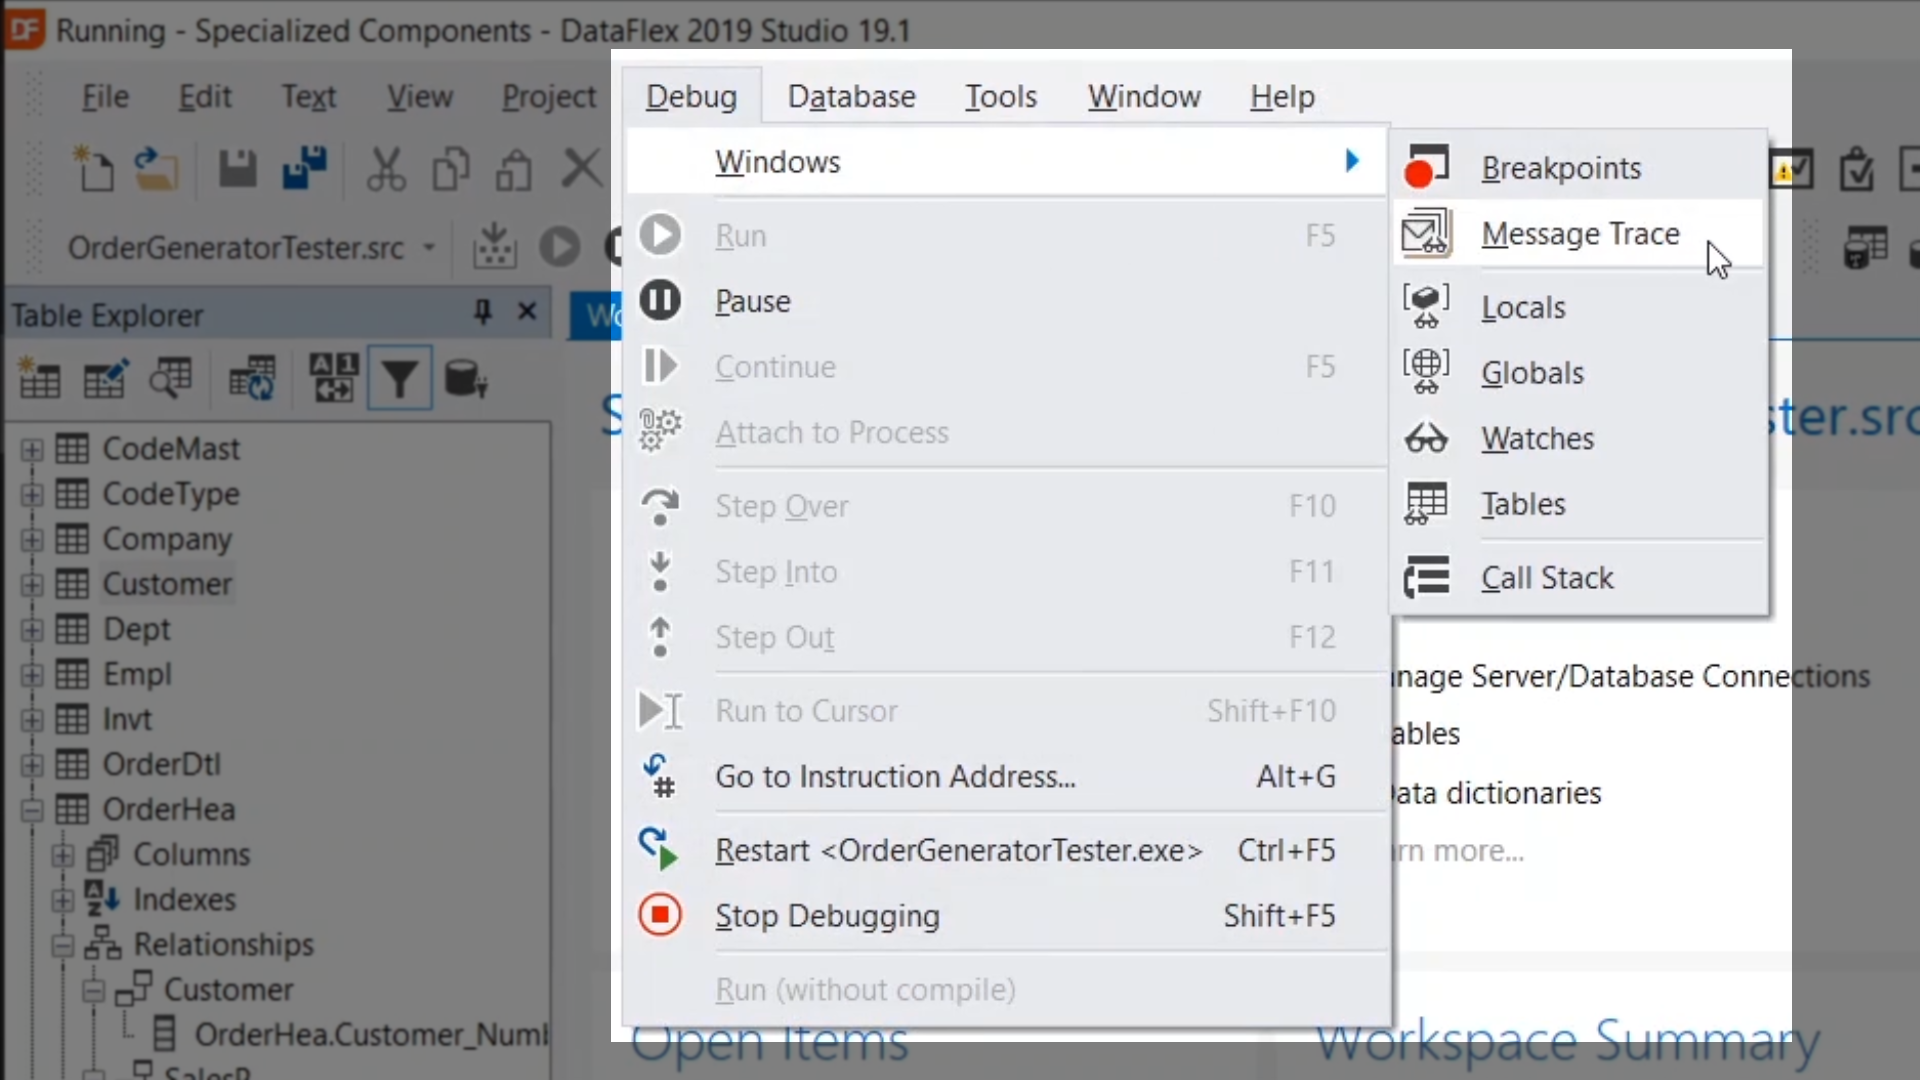
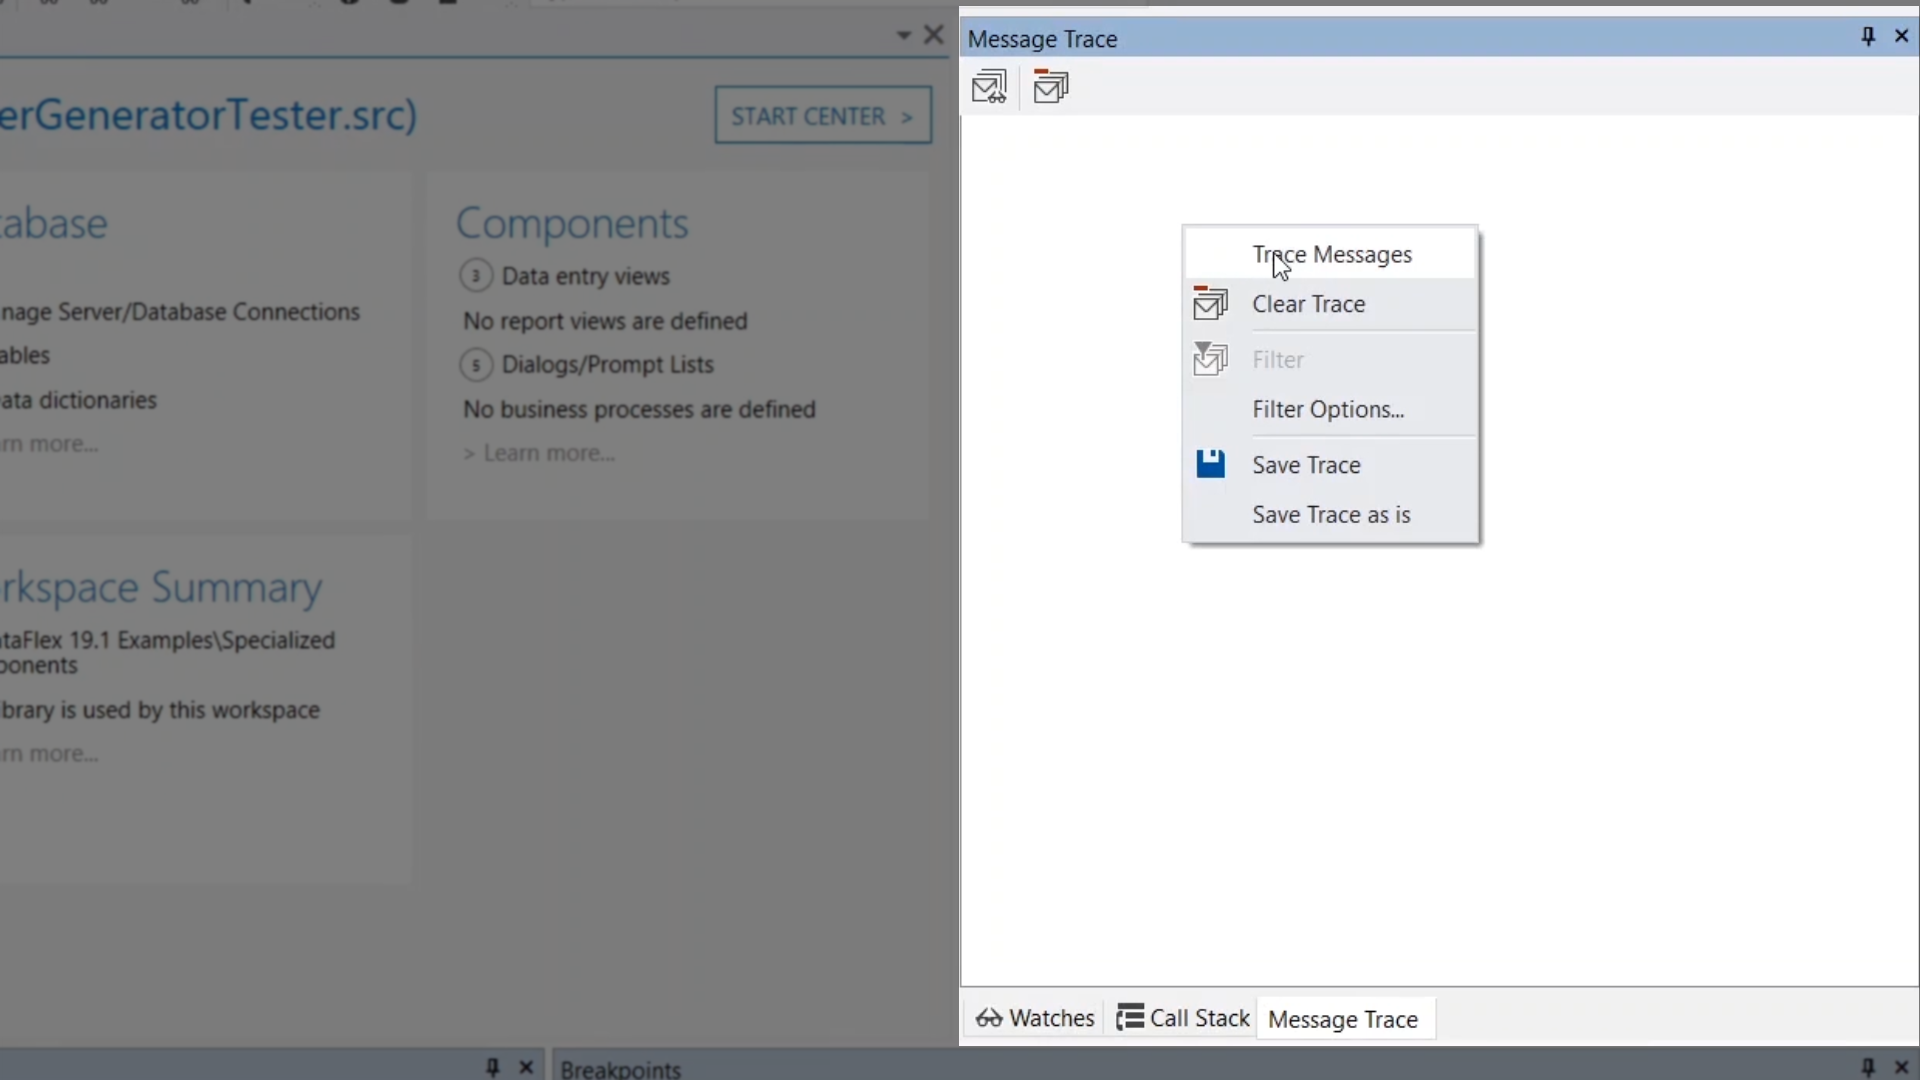
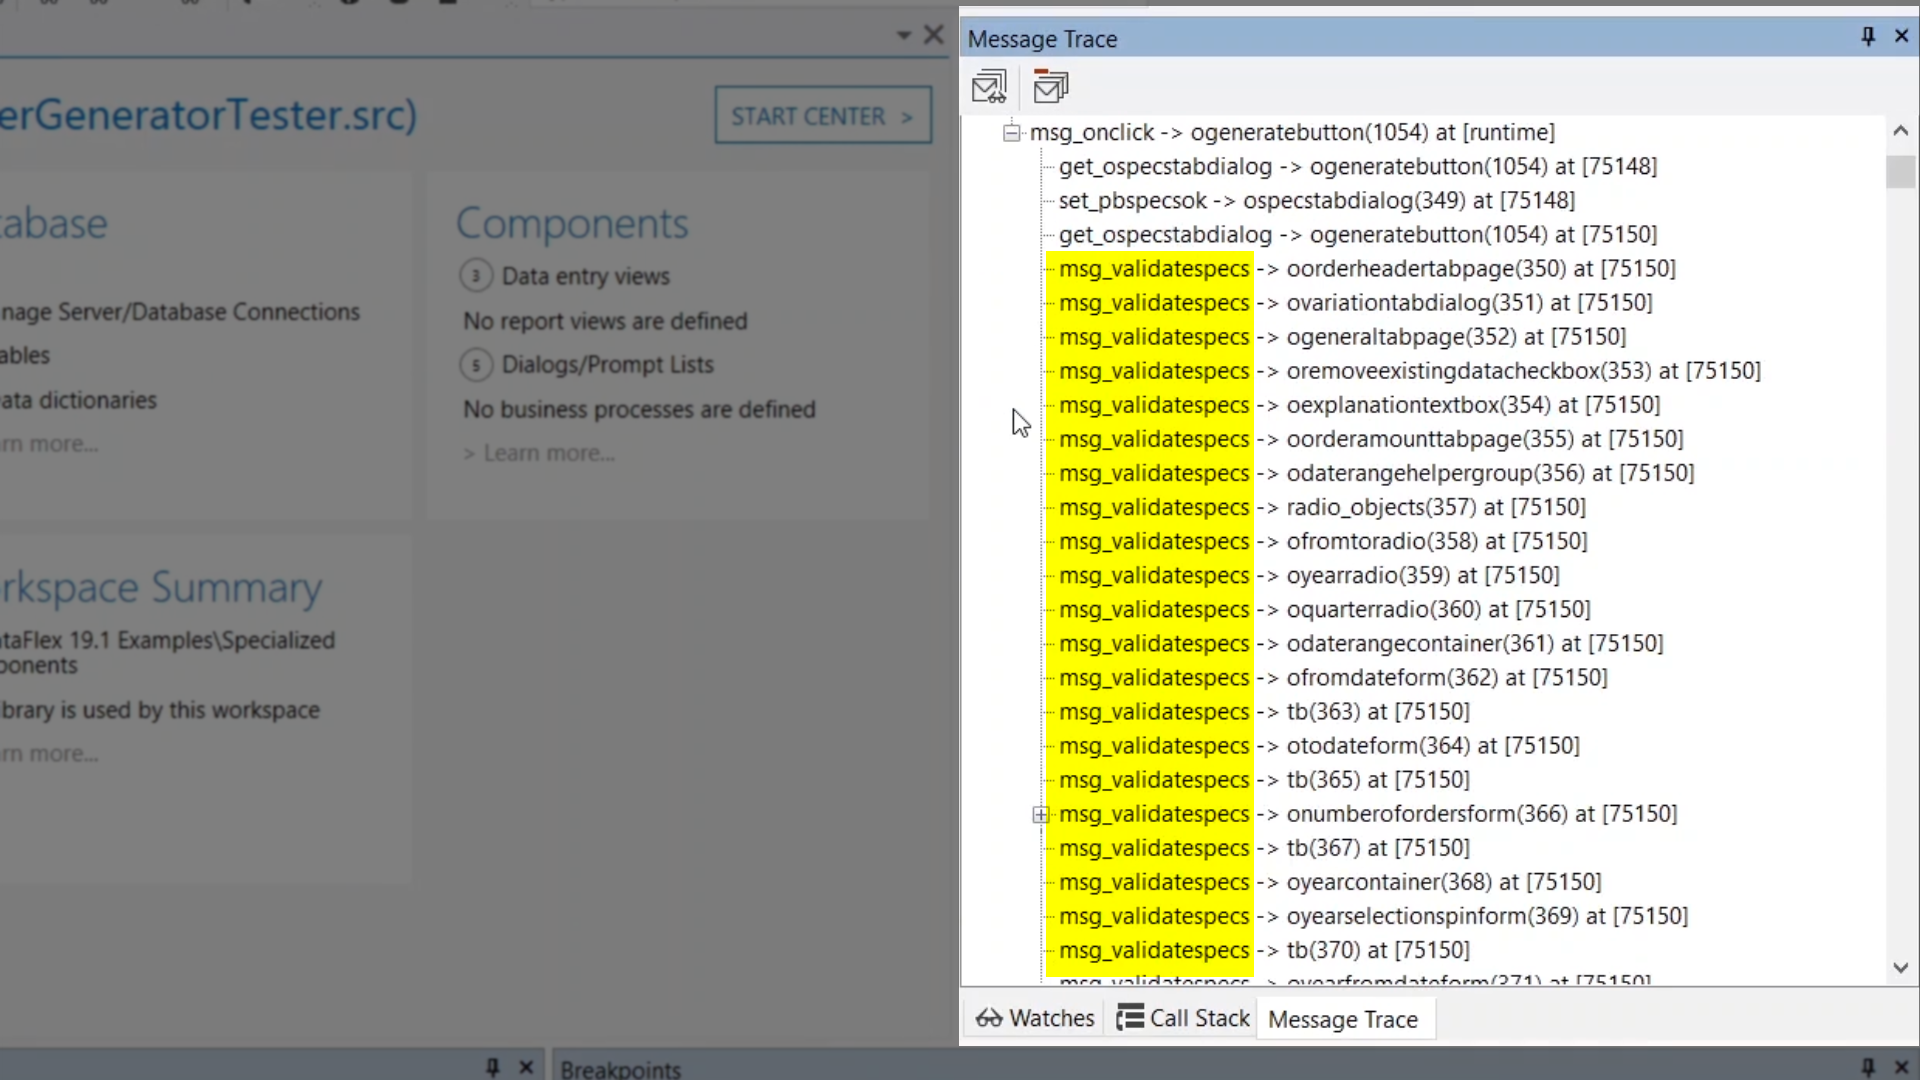
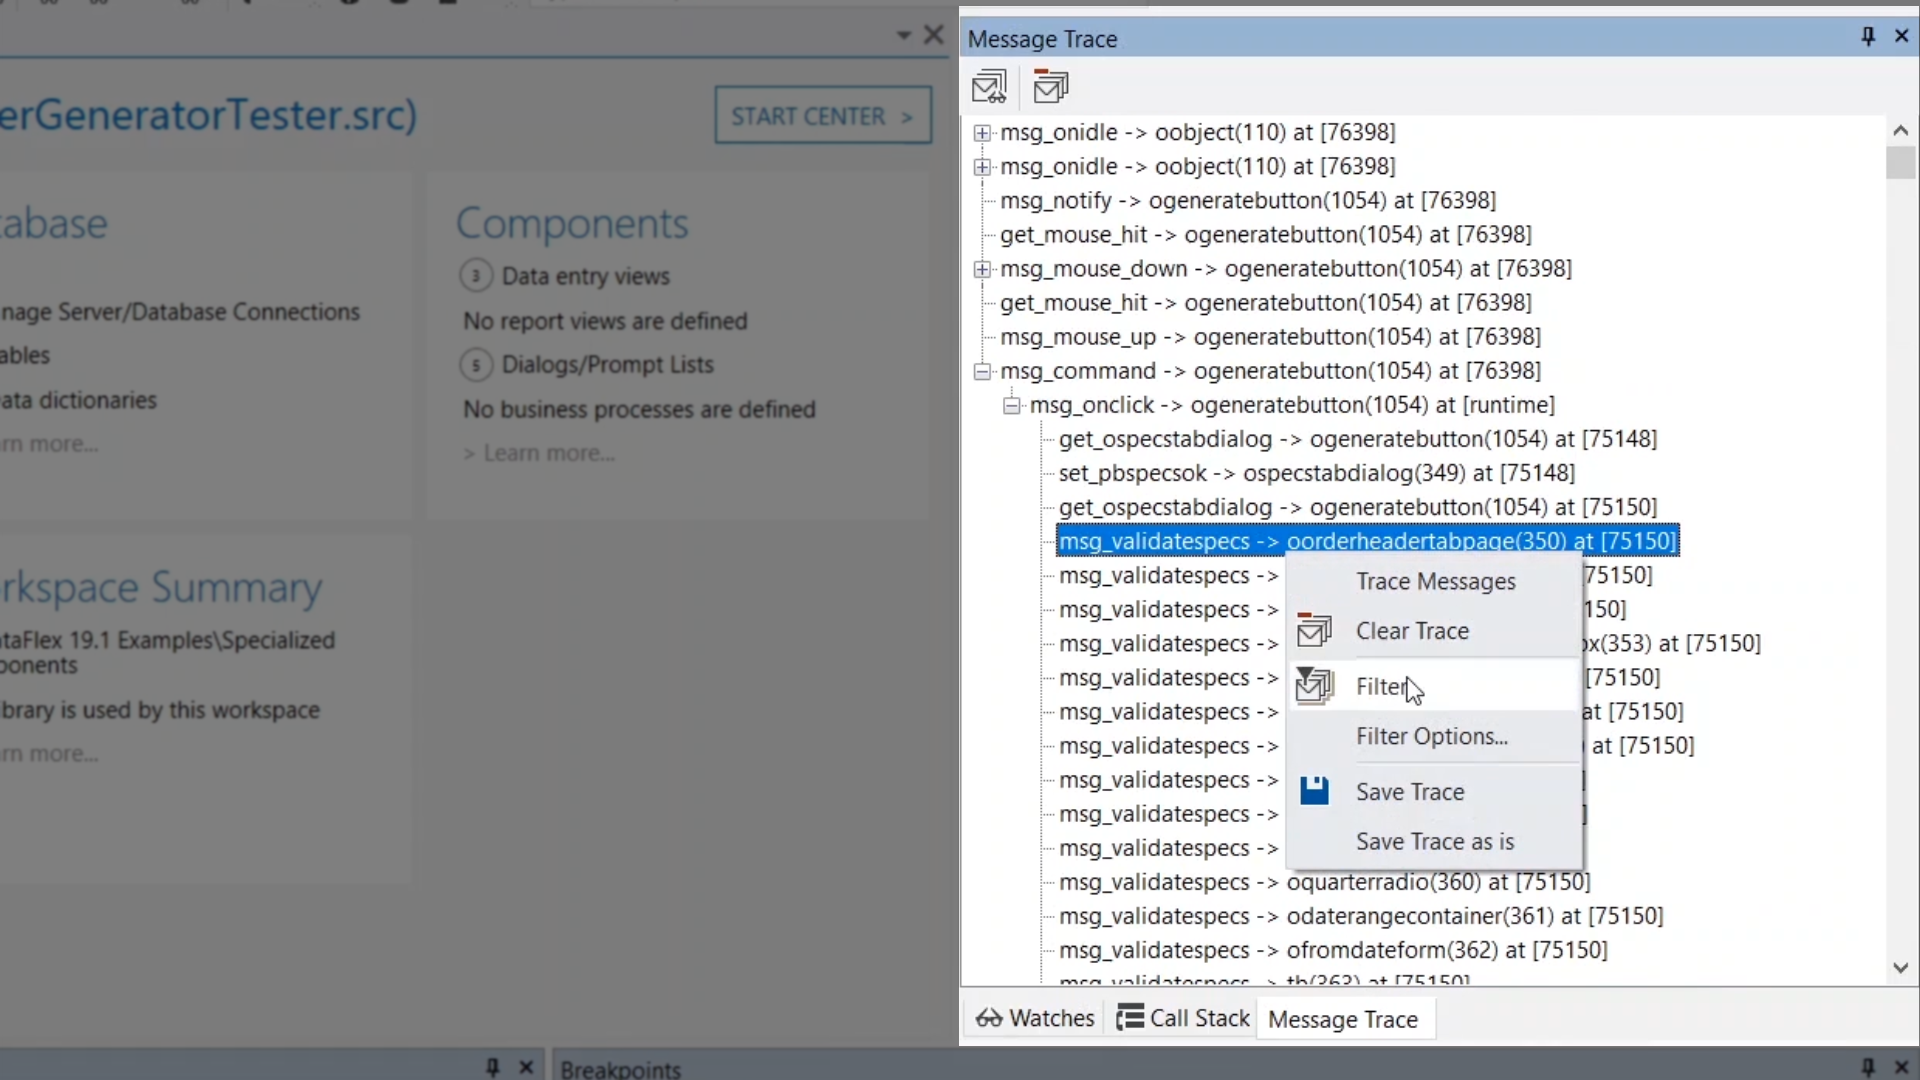
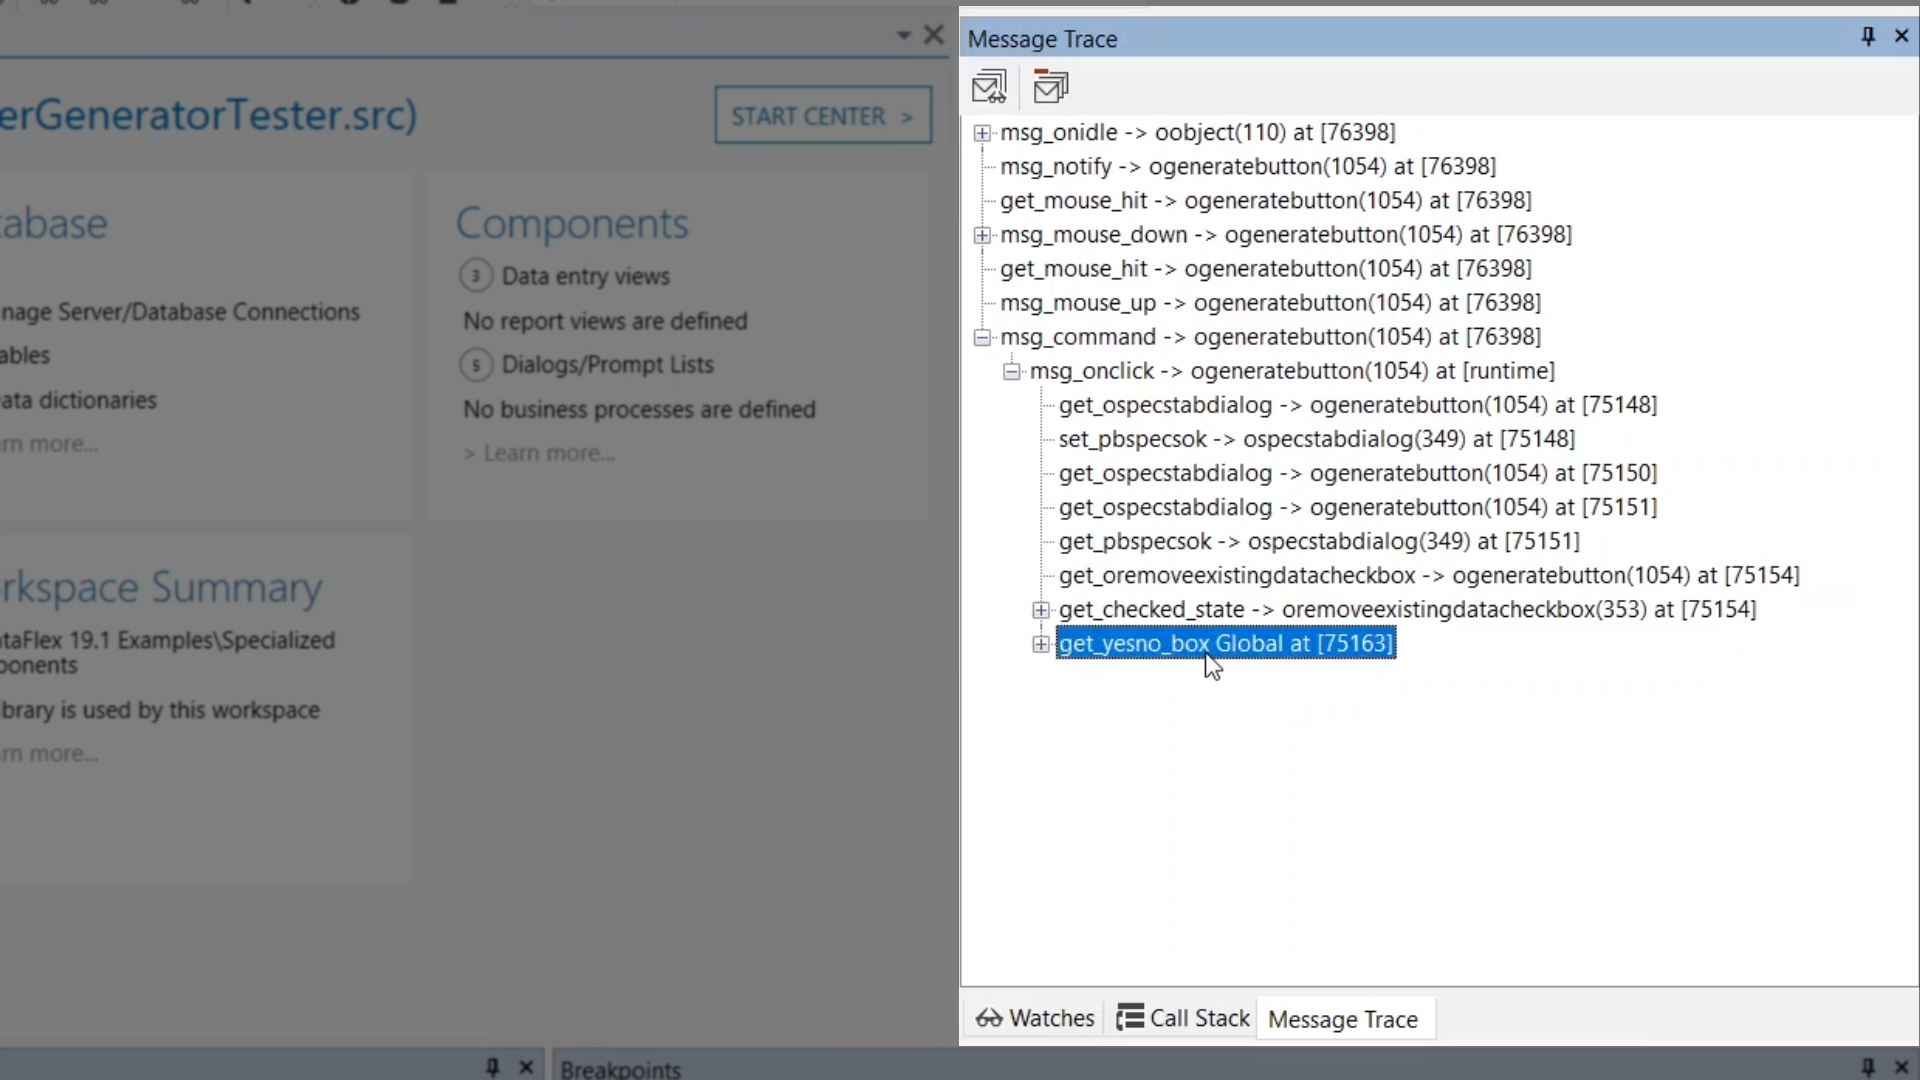
Messages can be traced as a program is executing, both while running or being stepped through. Frequent messages can be filtered out to reduce unimportant messages and create a clearer trace. Message traces can be saved as plain text files. 

Tracing all of the messages being sent during a program can be quite useful. For example, when trying to figure out which message would be a good hook for performing a certain operation. 


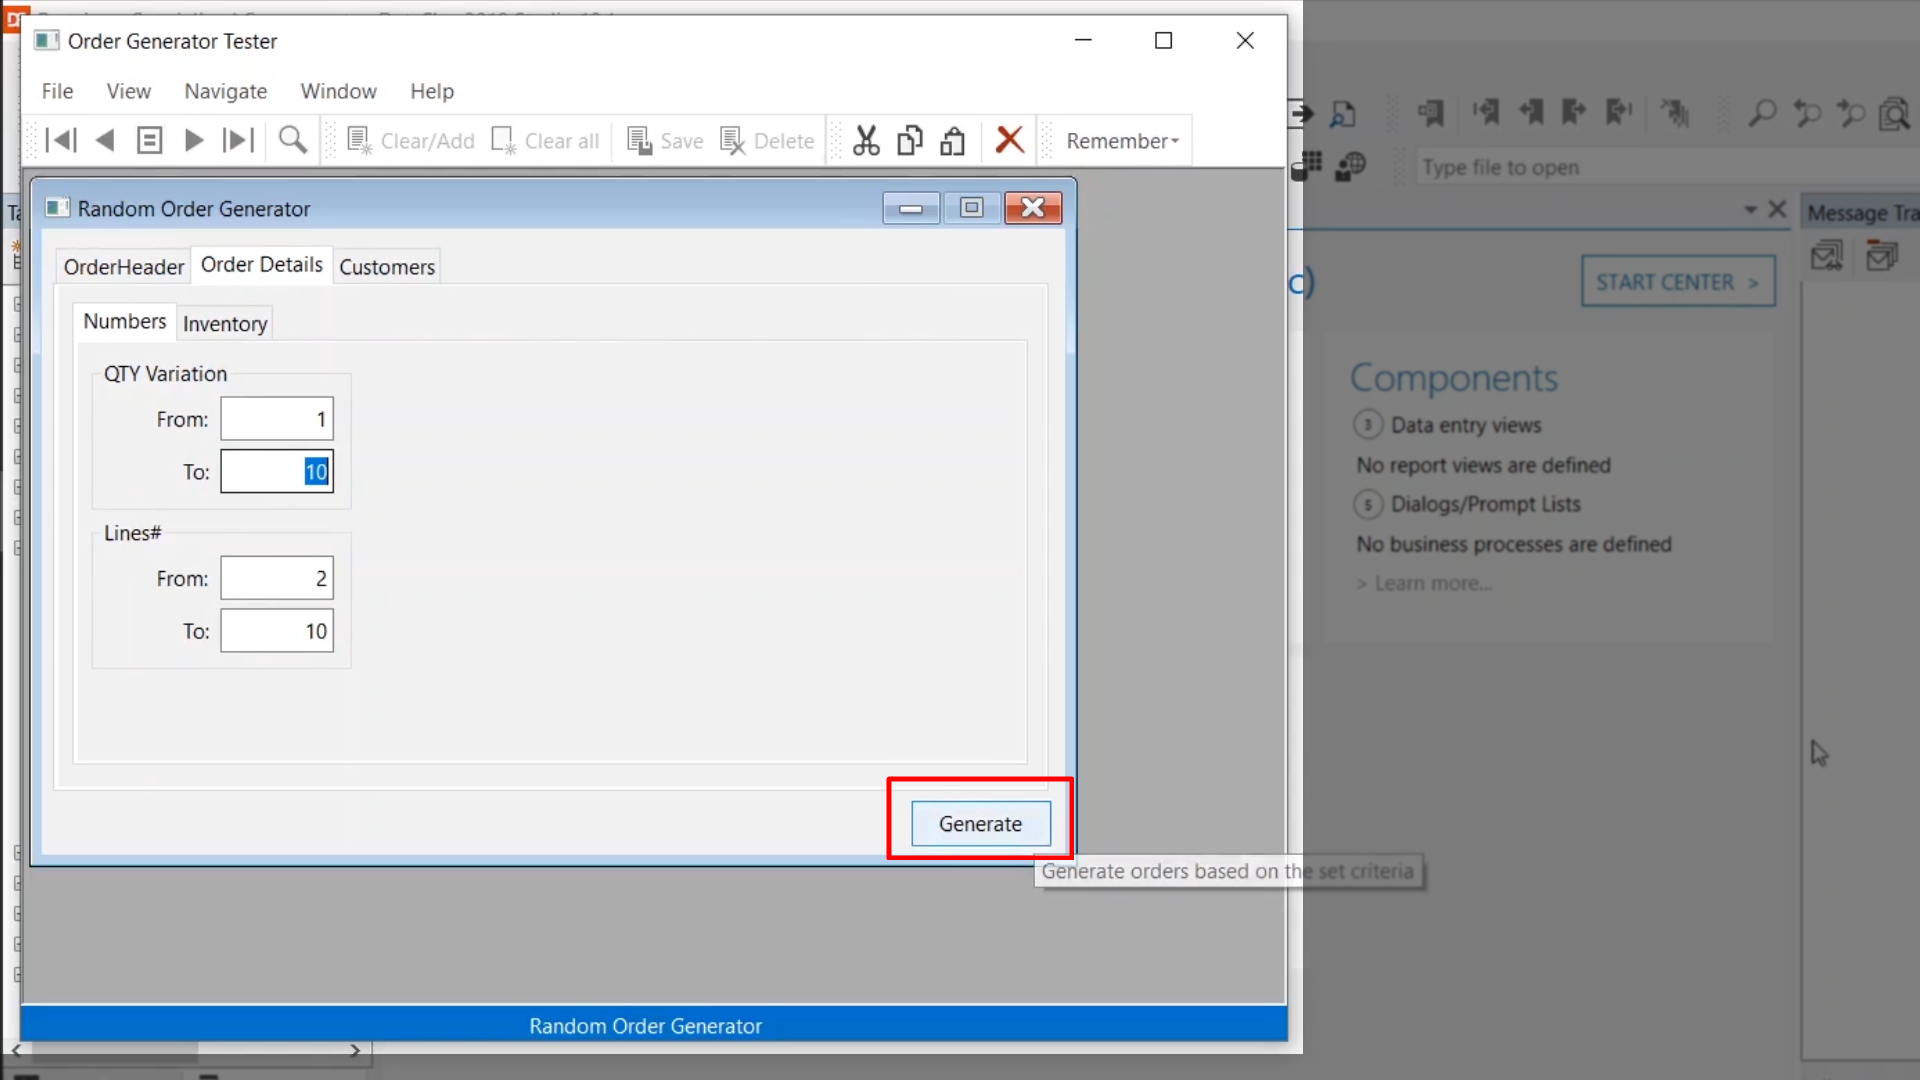
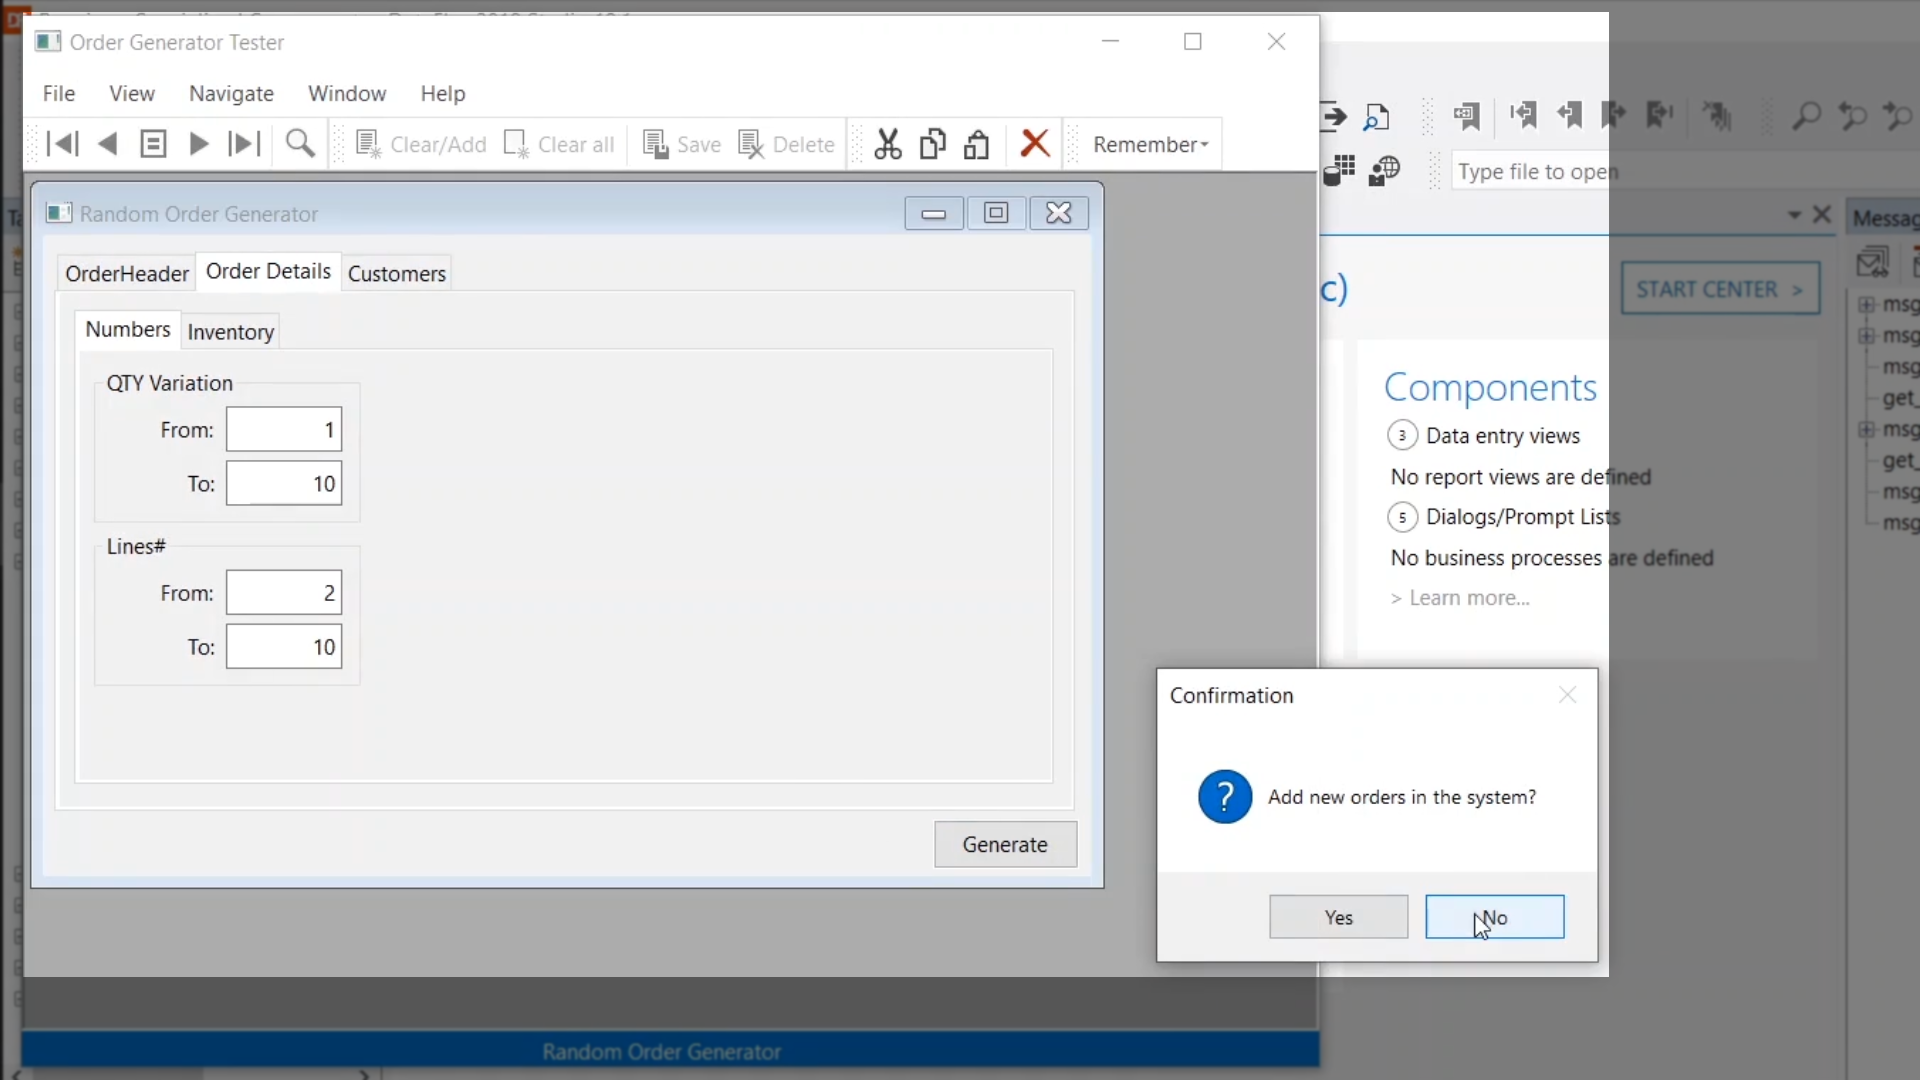
Demonstration – Messages sent when the button is selected in the OrderGenerator.vw

  1. From the top menu select DEBUG > WINDOWS > MESSAGE TRACE
  2. Select Restart from the toolbar
  3. Move through the program until just before messages are to be traced; in this example just prior to selecting the ‘Generate’ button
  4. Switch to the Debugger and toggle on the message trace by right clicking in the Message Trace window and selecting ‘Trace Messages’
  5. Switch back to the program and select the ‘Generate’ button
  6. When the Yes/No dialogue window appears, switch to the Debugger again, right click in the Message Trace window, and select to toggle off ‘Message Trace’
  7. The first time this is done with this program there will so many ‘msg_validatespecs’ messages listed that it will be difficult to make sense of anything else being displayed
  8. Right click on a ‘msg_validatespecs’ message in the Message Trace window and select ‘Filter’ to apply a filter to remove to the messages from the results the next time a trace is run
  9. Right click in the Message Trace window and select ‘Clear Trace’
  10. Rerun the program following the same steps as before to now see the results without all of the ‘msg_validatespecs’ messages
  11. When a message is clicked in the Message Trace window the Debugger will display the method that has been selected
  12. At this point…
    • Breakpoints can be added for further evaluation
    • The program can be paused causing the Debugger will switch to ‘limited break mode,’ so that the Call Stack can be used to figure out how this point in the program was reached