Debugging DataFlex Apps
Lesson 4: Locals, Globals, Call Stack windows & useful actions
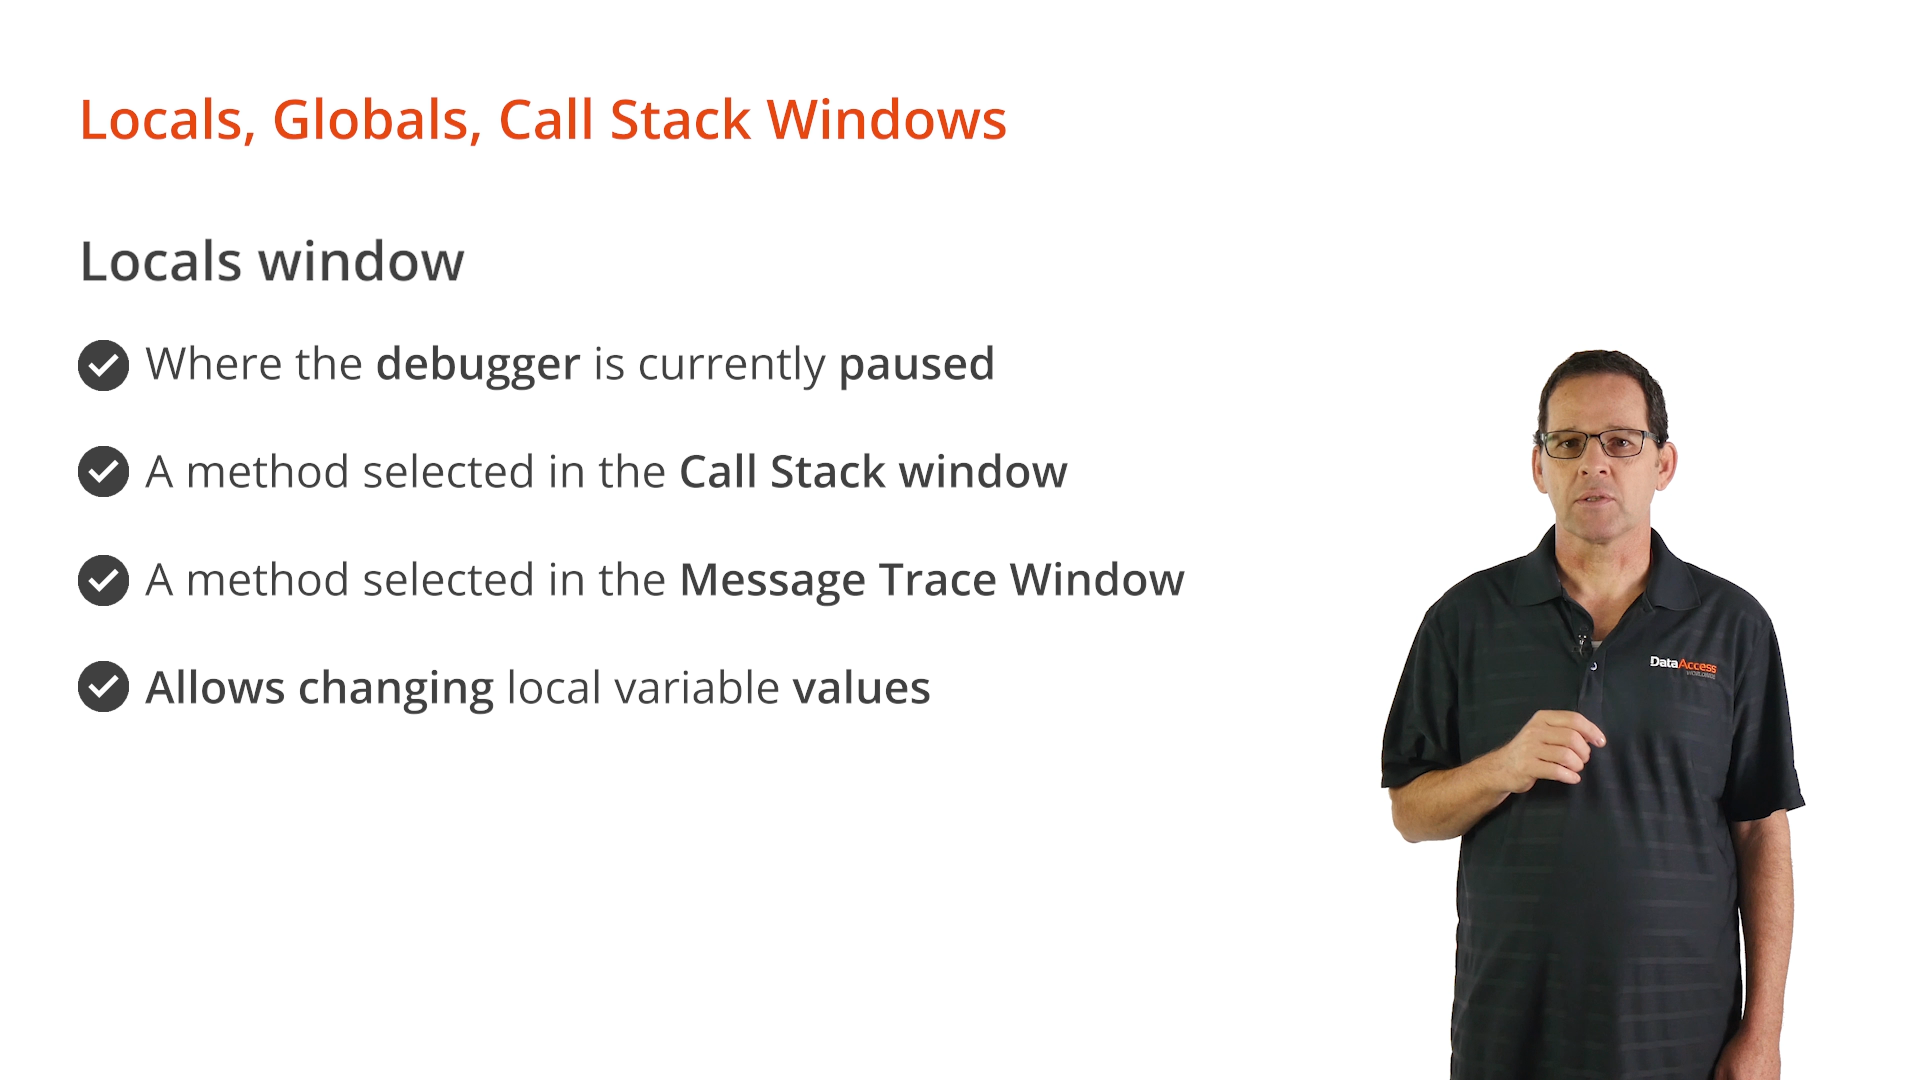
- The Locals window lists all local variables in the following context…
- Where the Debugger is currently paused
- The method selected in the Call Stack window
- The method selected in the Message Trace window
- Note: Values of local variables can also be altered in the Locals window
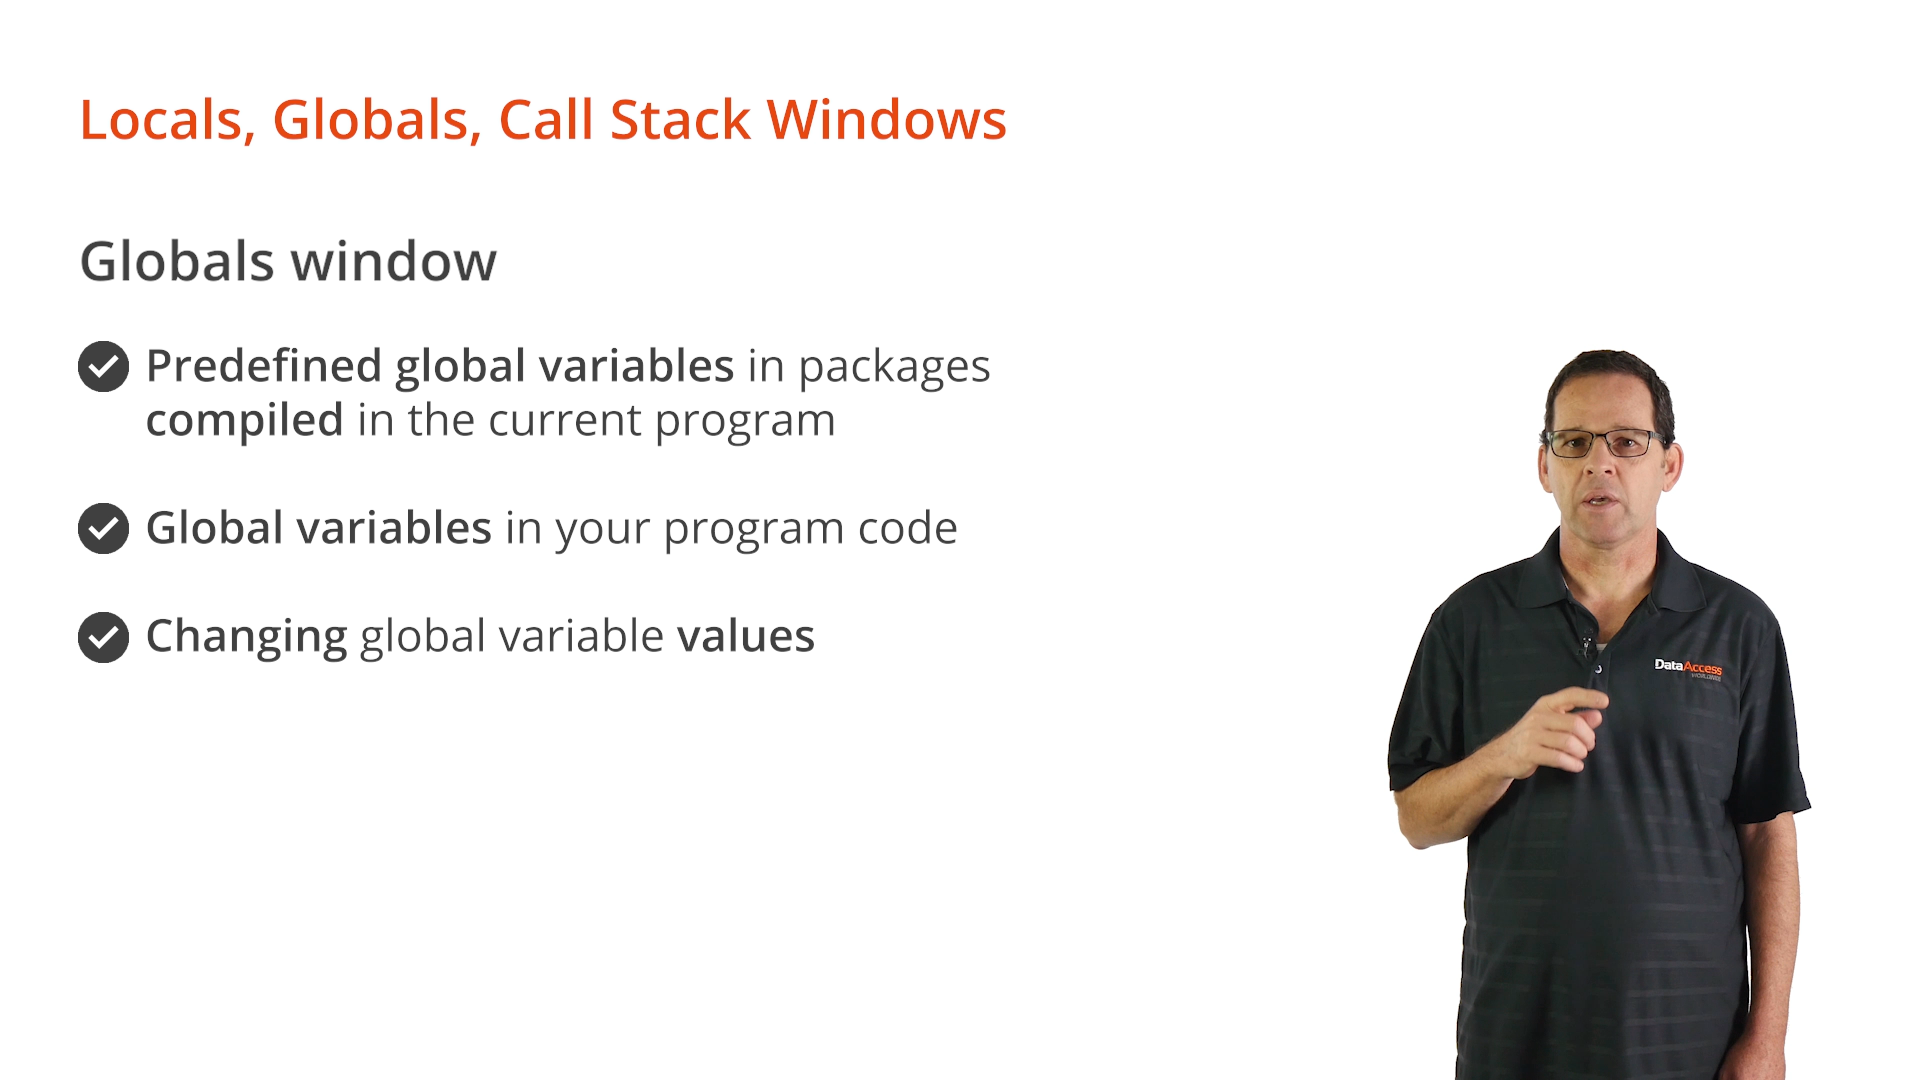
- The Globals Window lists…
- Predefined global variables in packages that are currently compiled the program
- Global variable in the program code
- Note: Values of global variables can also be altered in the Globals window
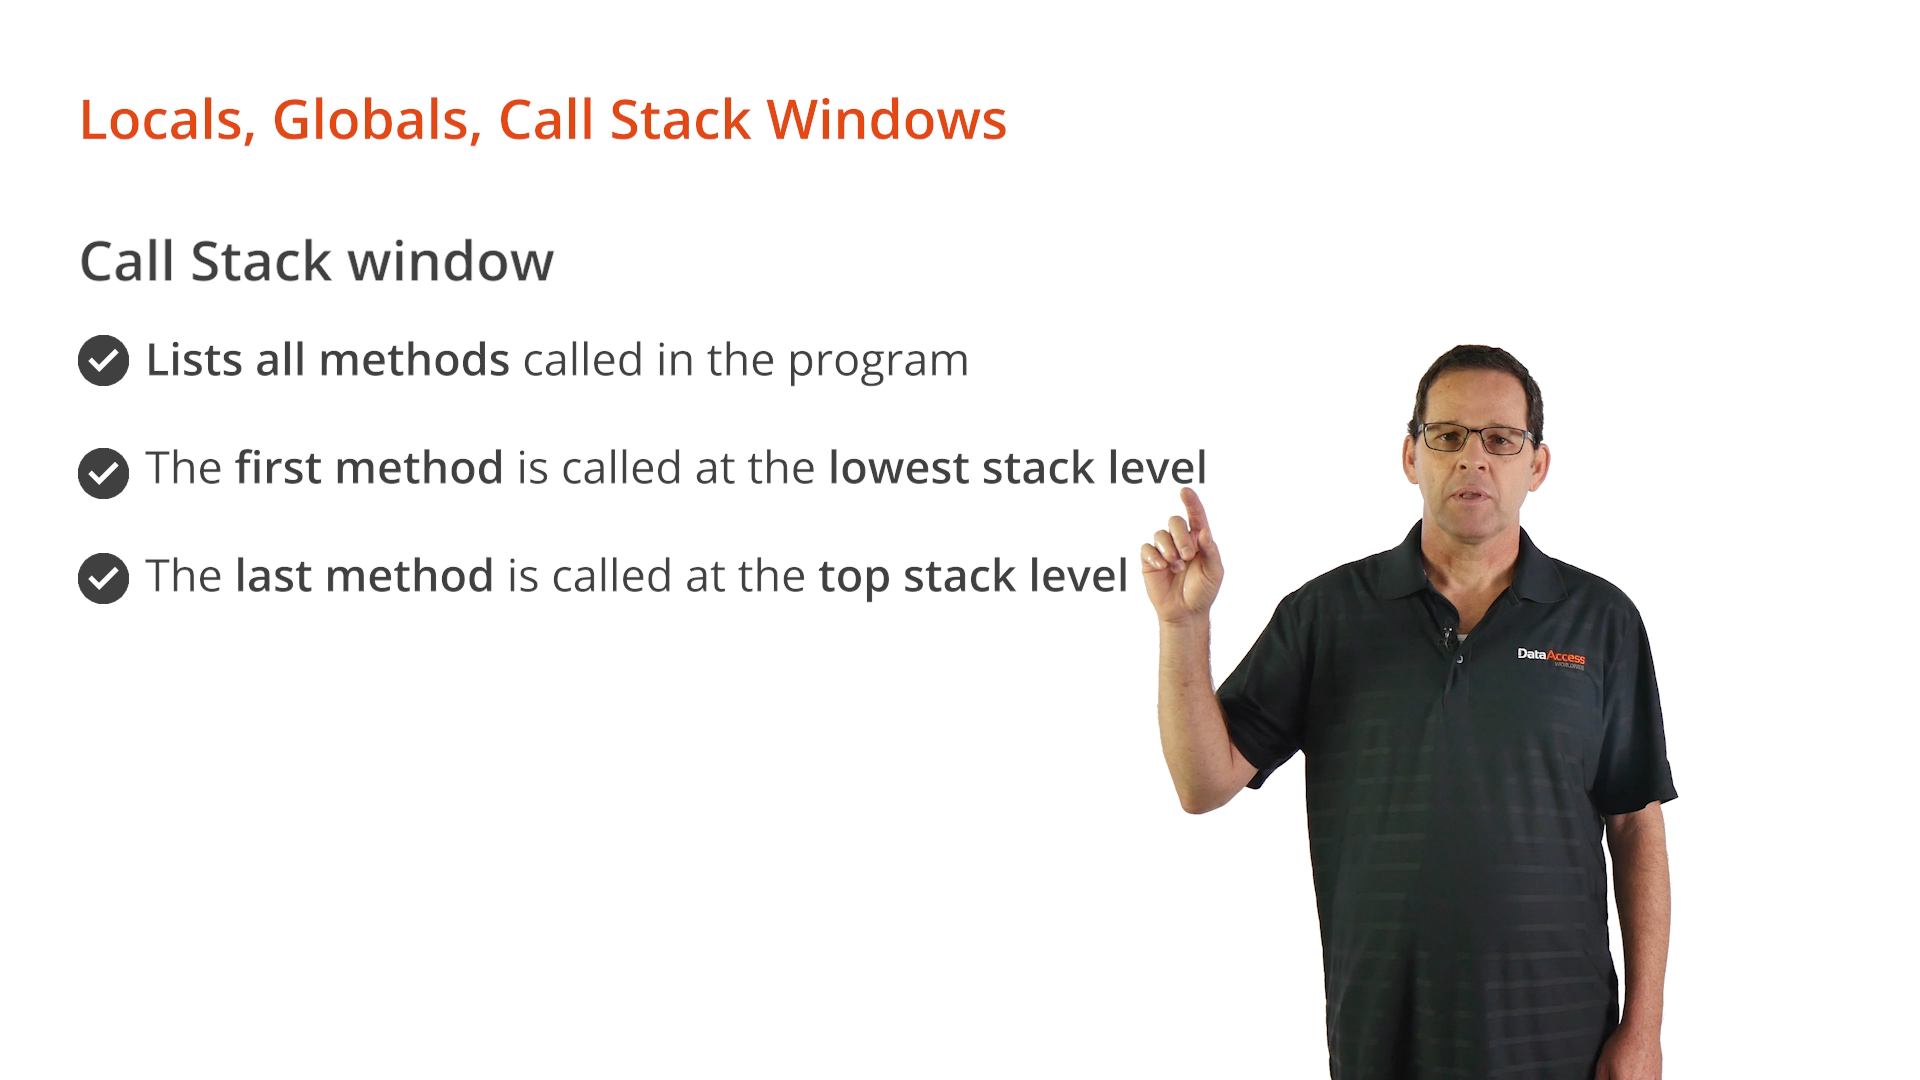
- The Call Stack Window…
- Lists all methods called in the program to reach the current execution point
- With the first method called at the lowest stack level
- With the last method called at the highest/top stack level
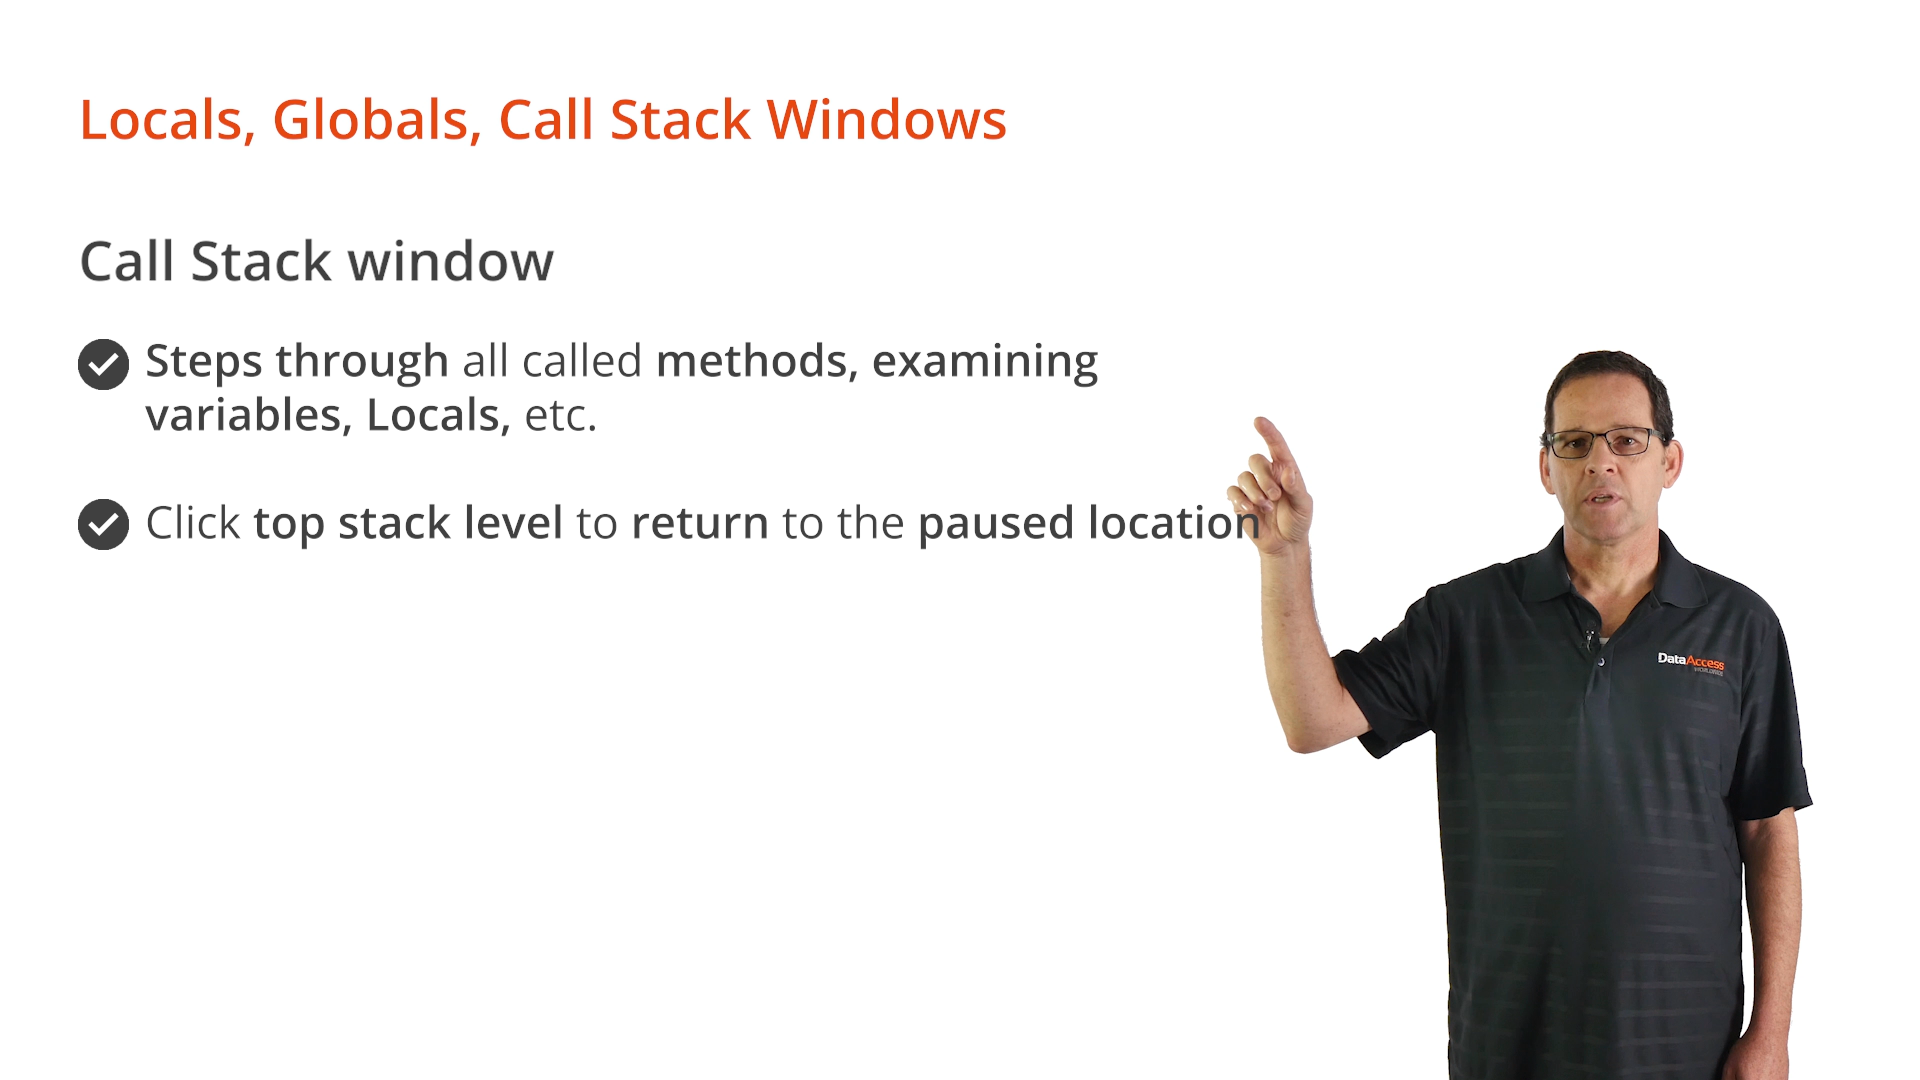
- Allows the stepping through of all called methods while examining variables, locals, and so on in that context
- Click on the top stack level to return to where the Debugger is currently paused
Useful Actions While Debugging
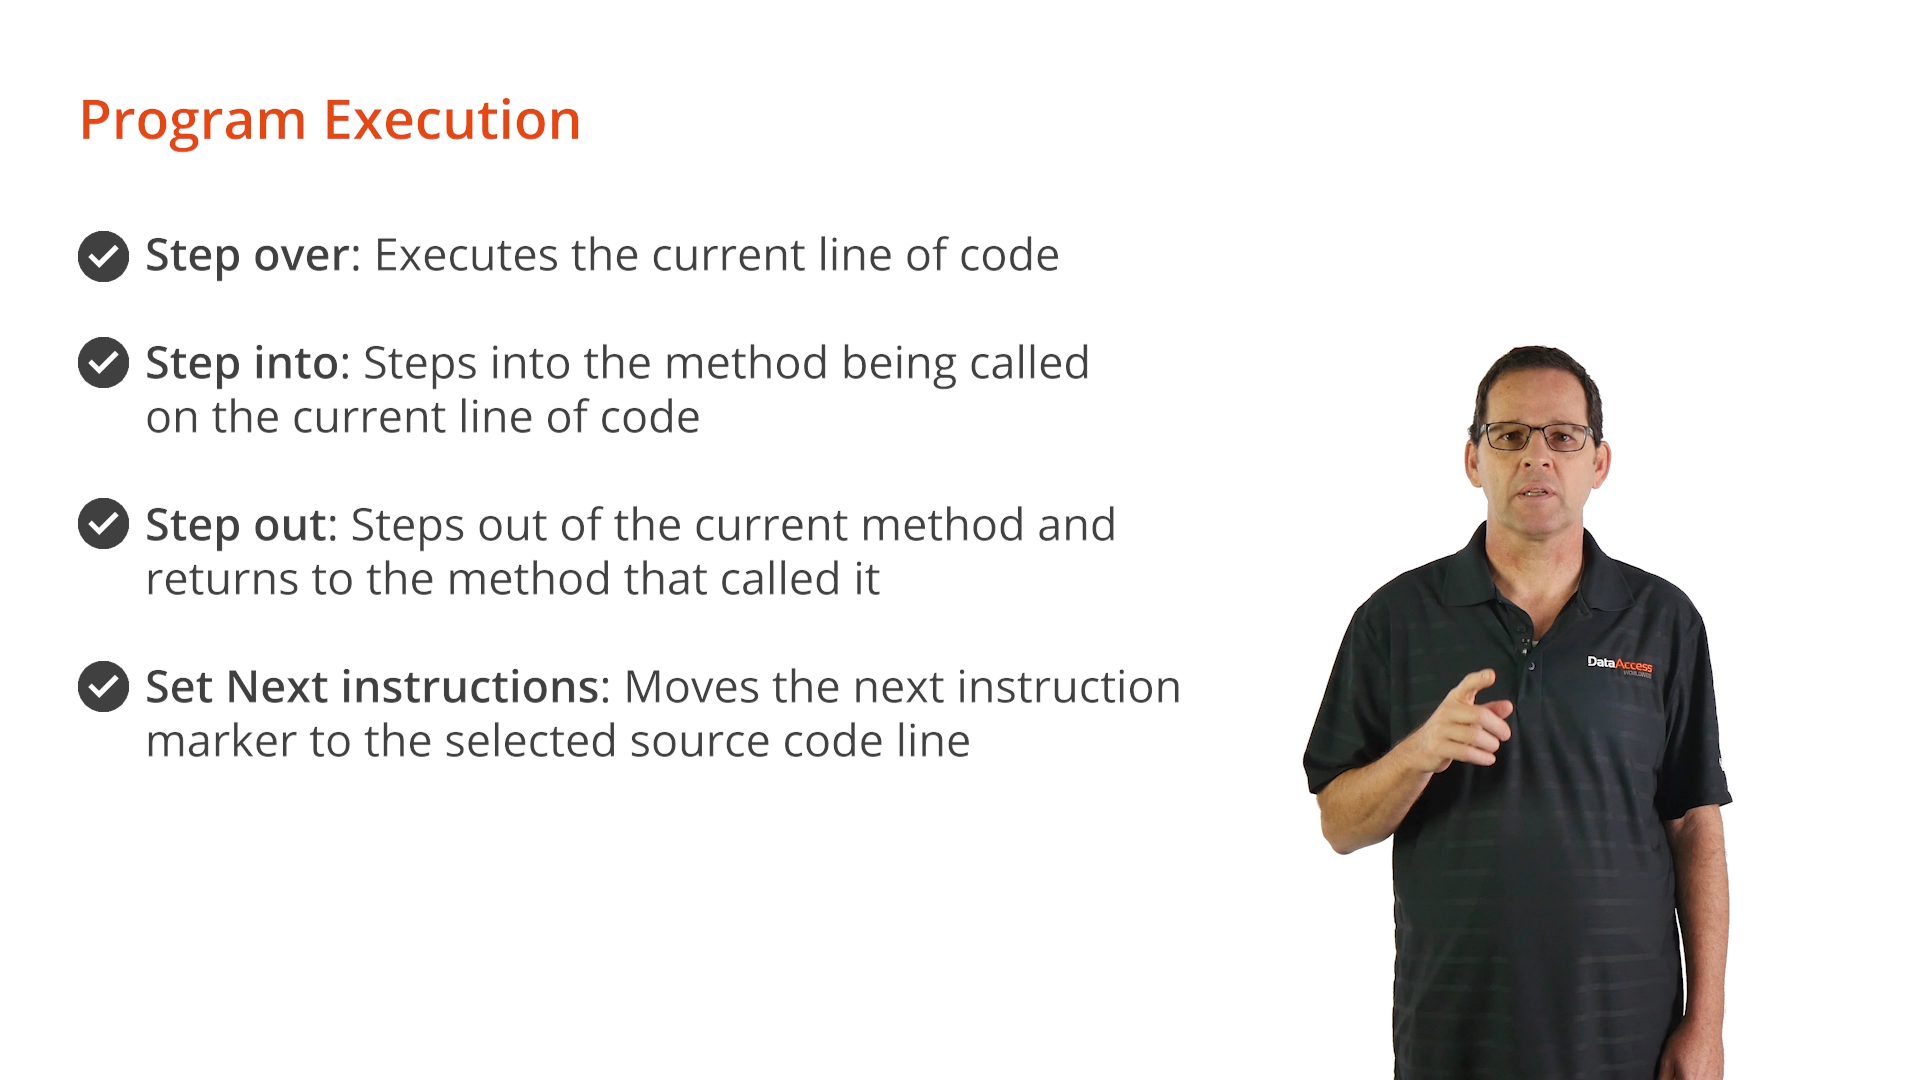
- Step Over: executes the current line of code and pauses on the following line
- Step Into: steps into the method being called on the current line of code
- Step Out: steps out of the current method and returns to the method that called it
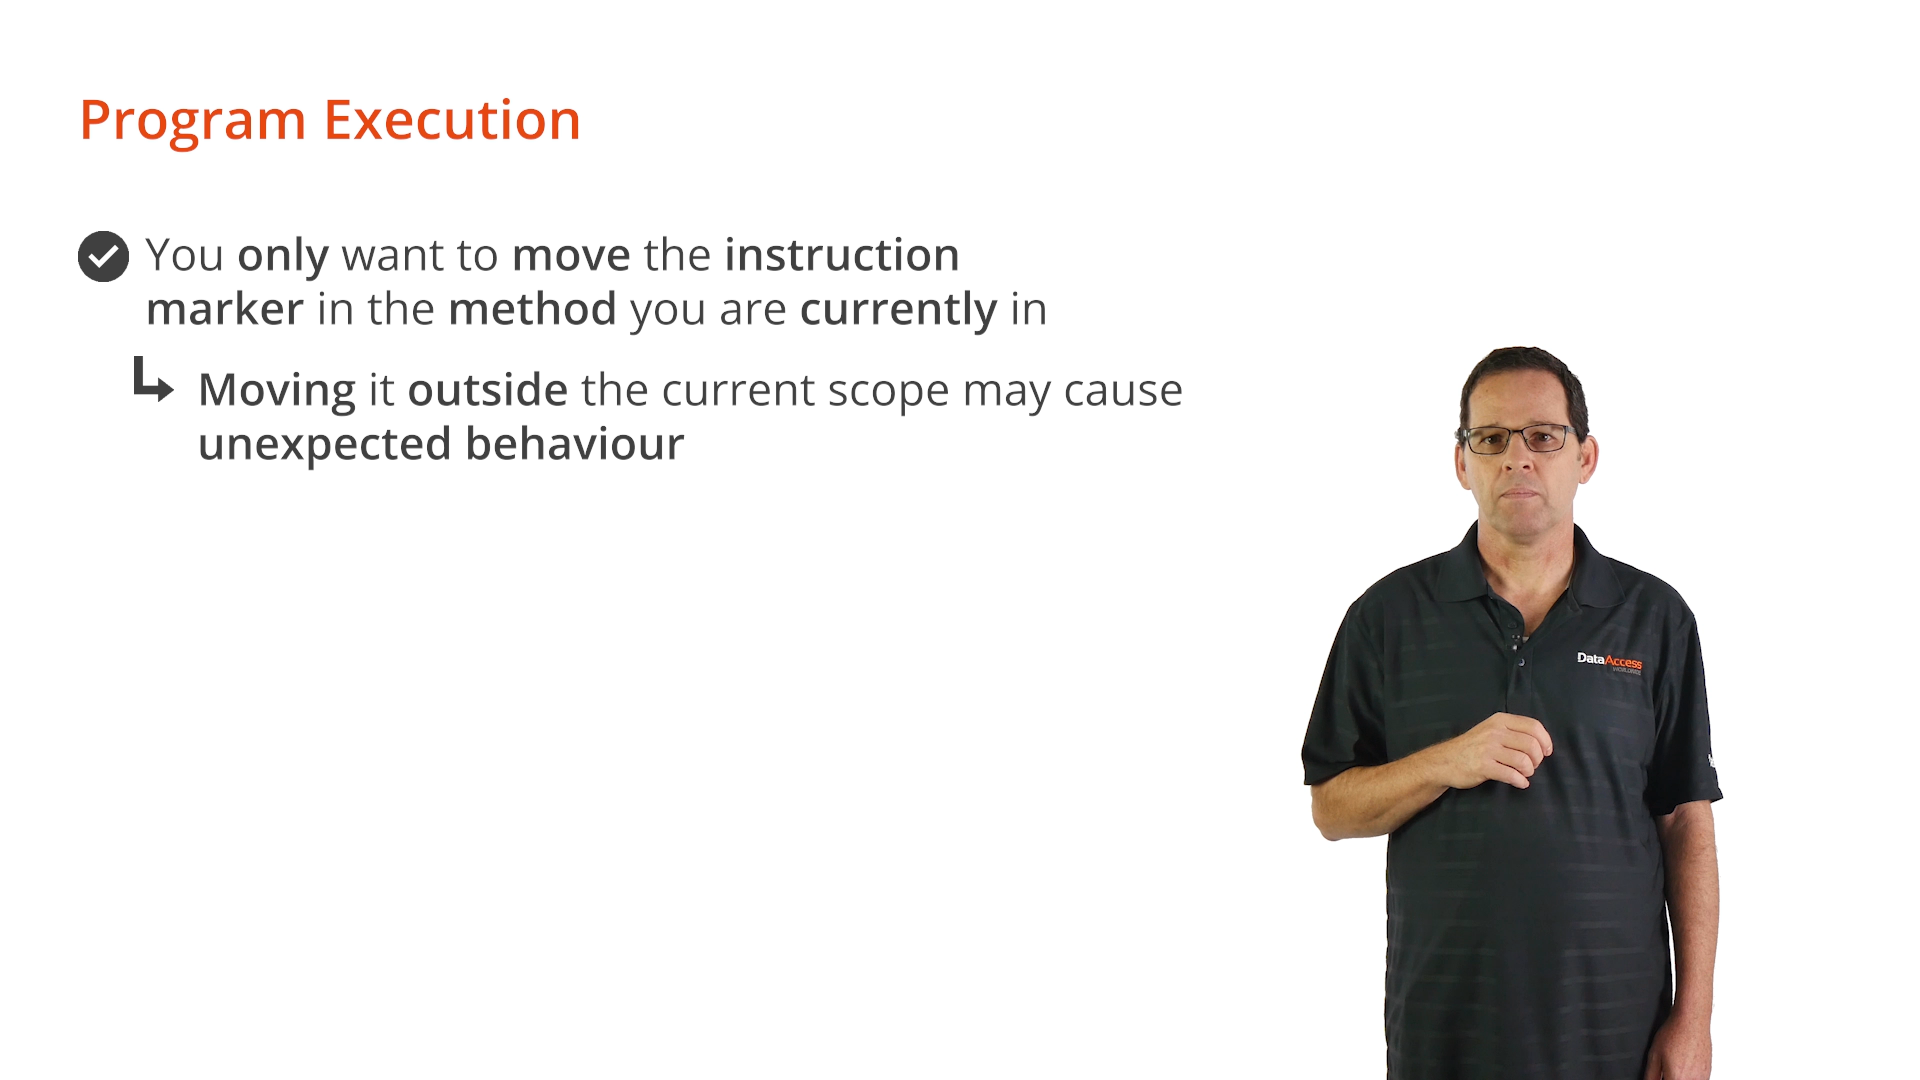
- Set Next Instruction: moves the instruction marker to the selected line of code
- Typically, the instruction marker is only moved within the method currently being worked on because moving outside of the current scope may cause unexpected behavior
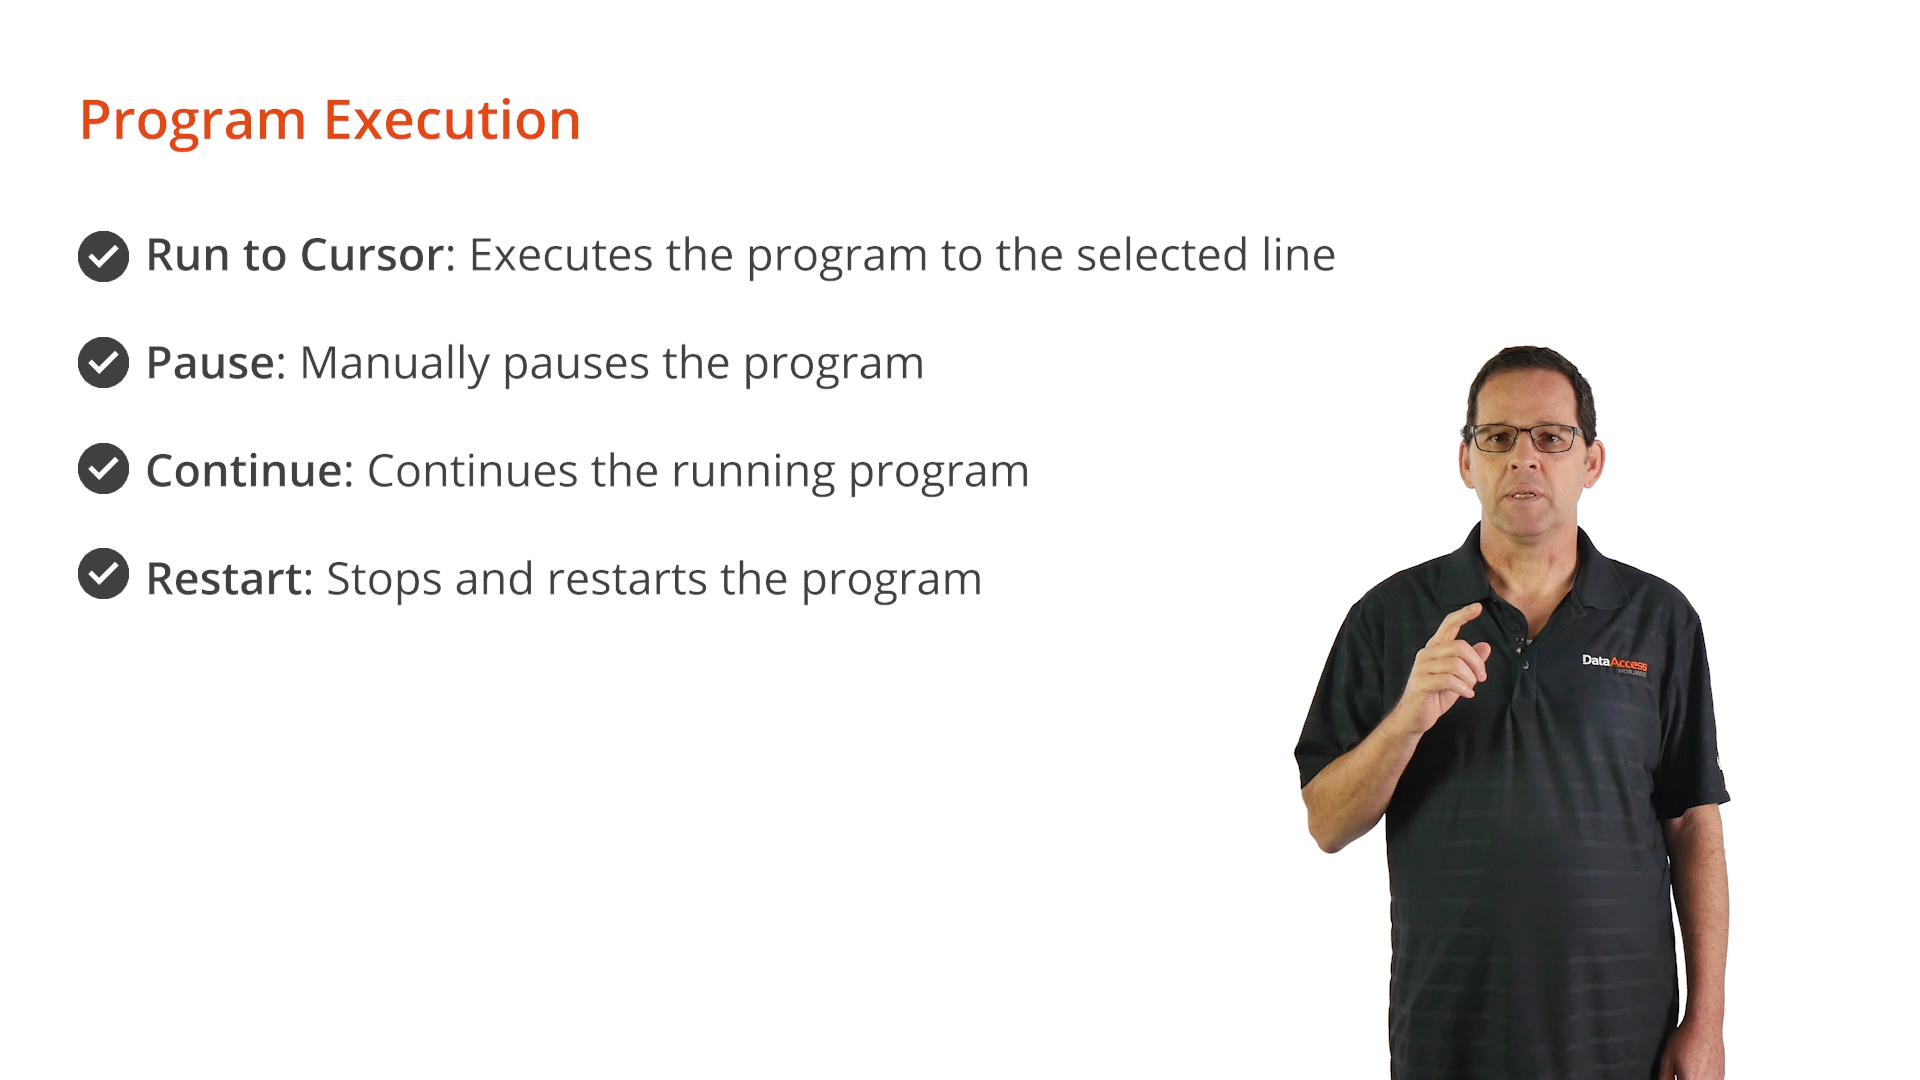
- Run to Cursor: executes the program to the selected line
- This allows the skipping of several lines of code with having ‘step over’ each one individually, and does stop at enabled breakpoints
- Pause: manually pauses the running program at the next possible opportunity without requiring a breakpoint
- Continue: continues the running program until a breakpoint is encountered or is manually paused
- Restart: stops and restarts the program in debug mode
Demonstration
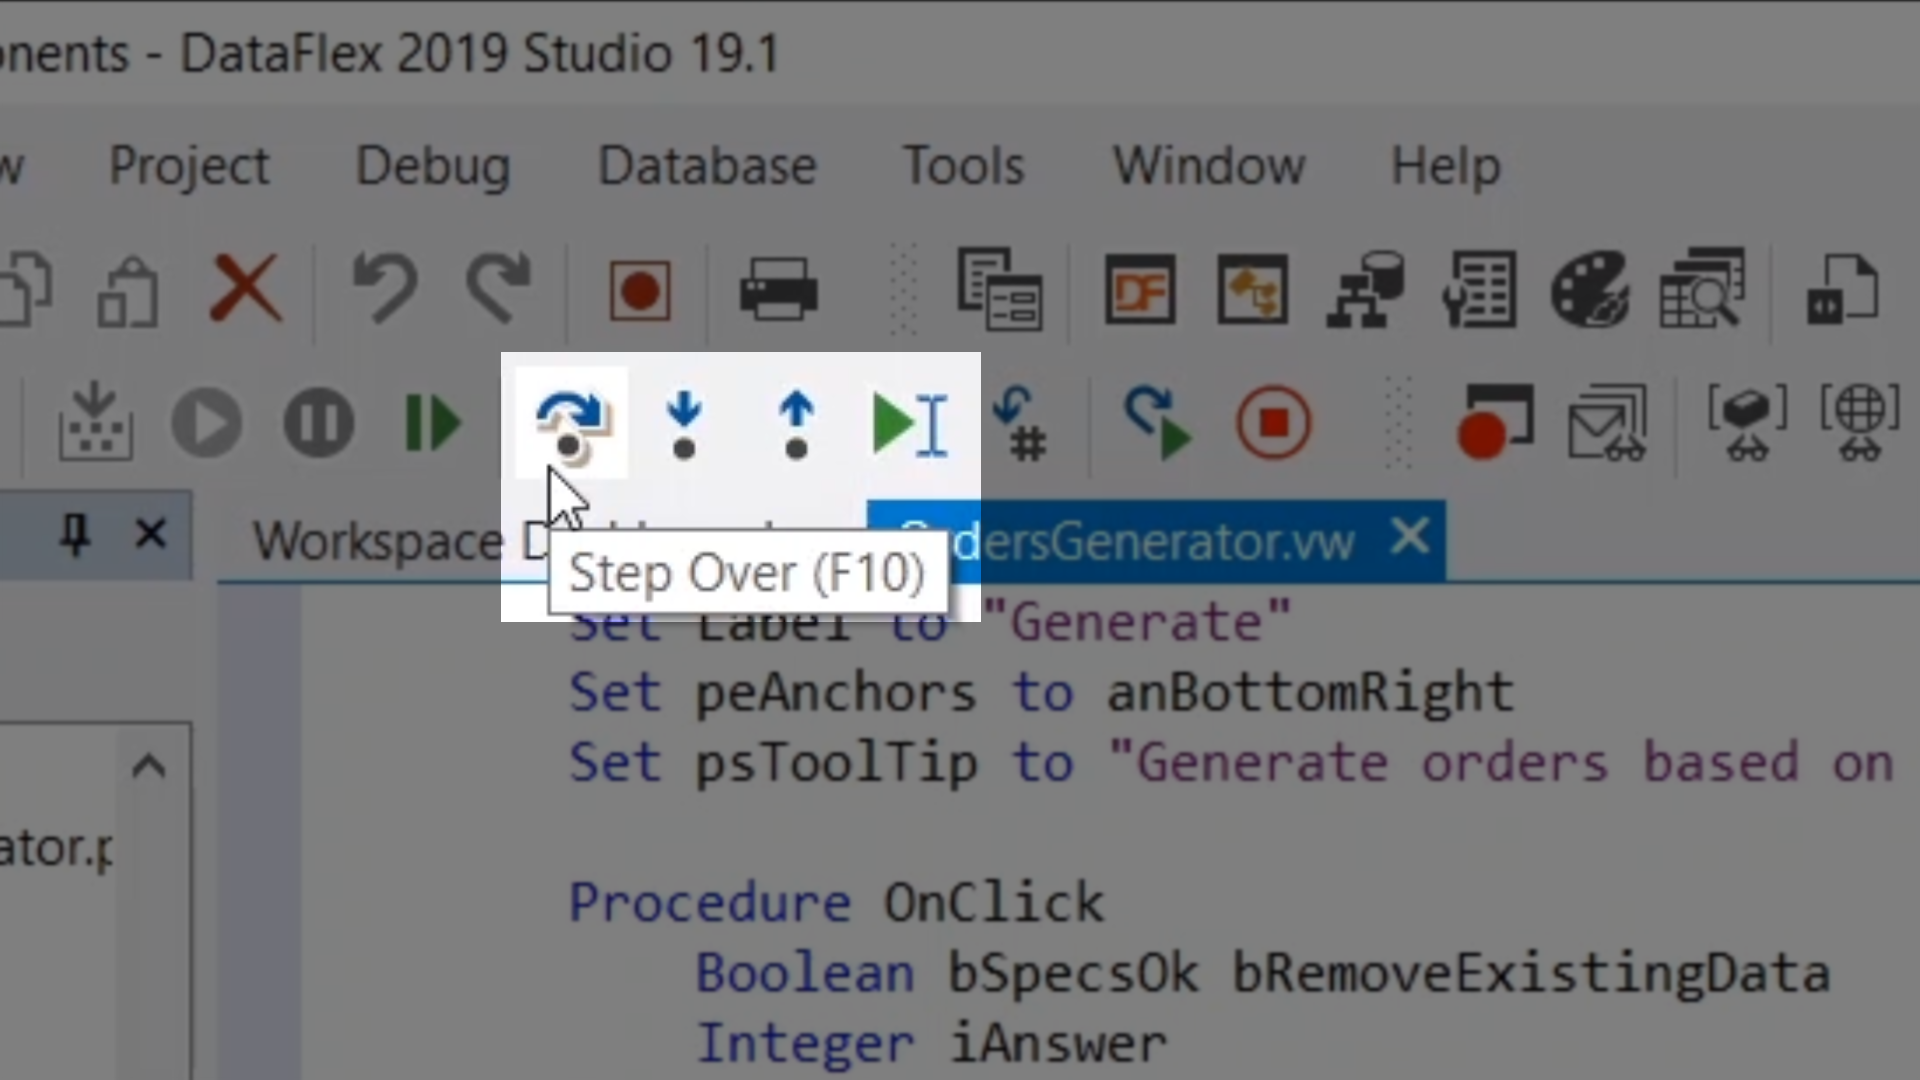
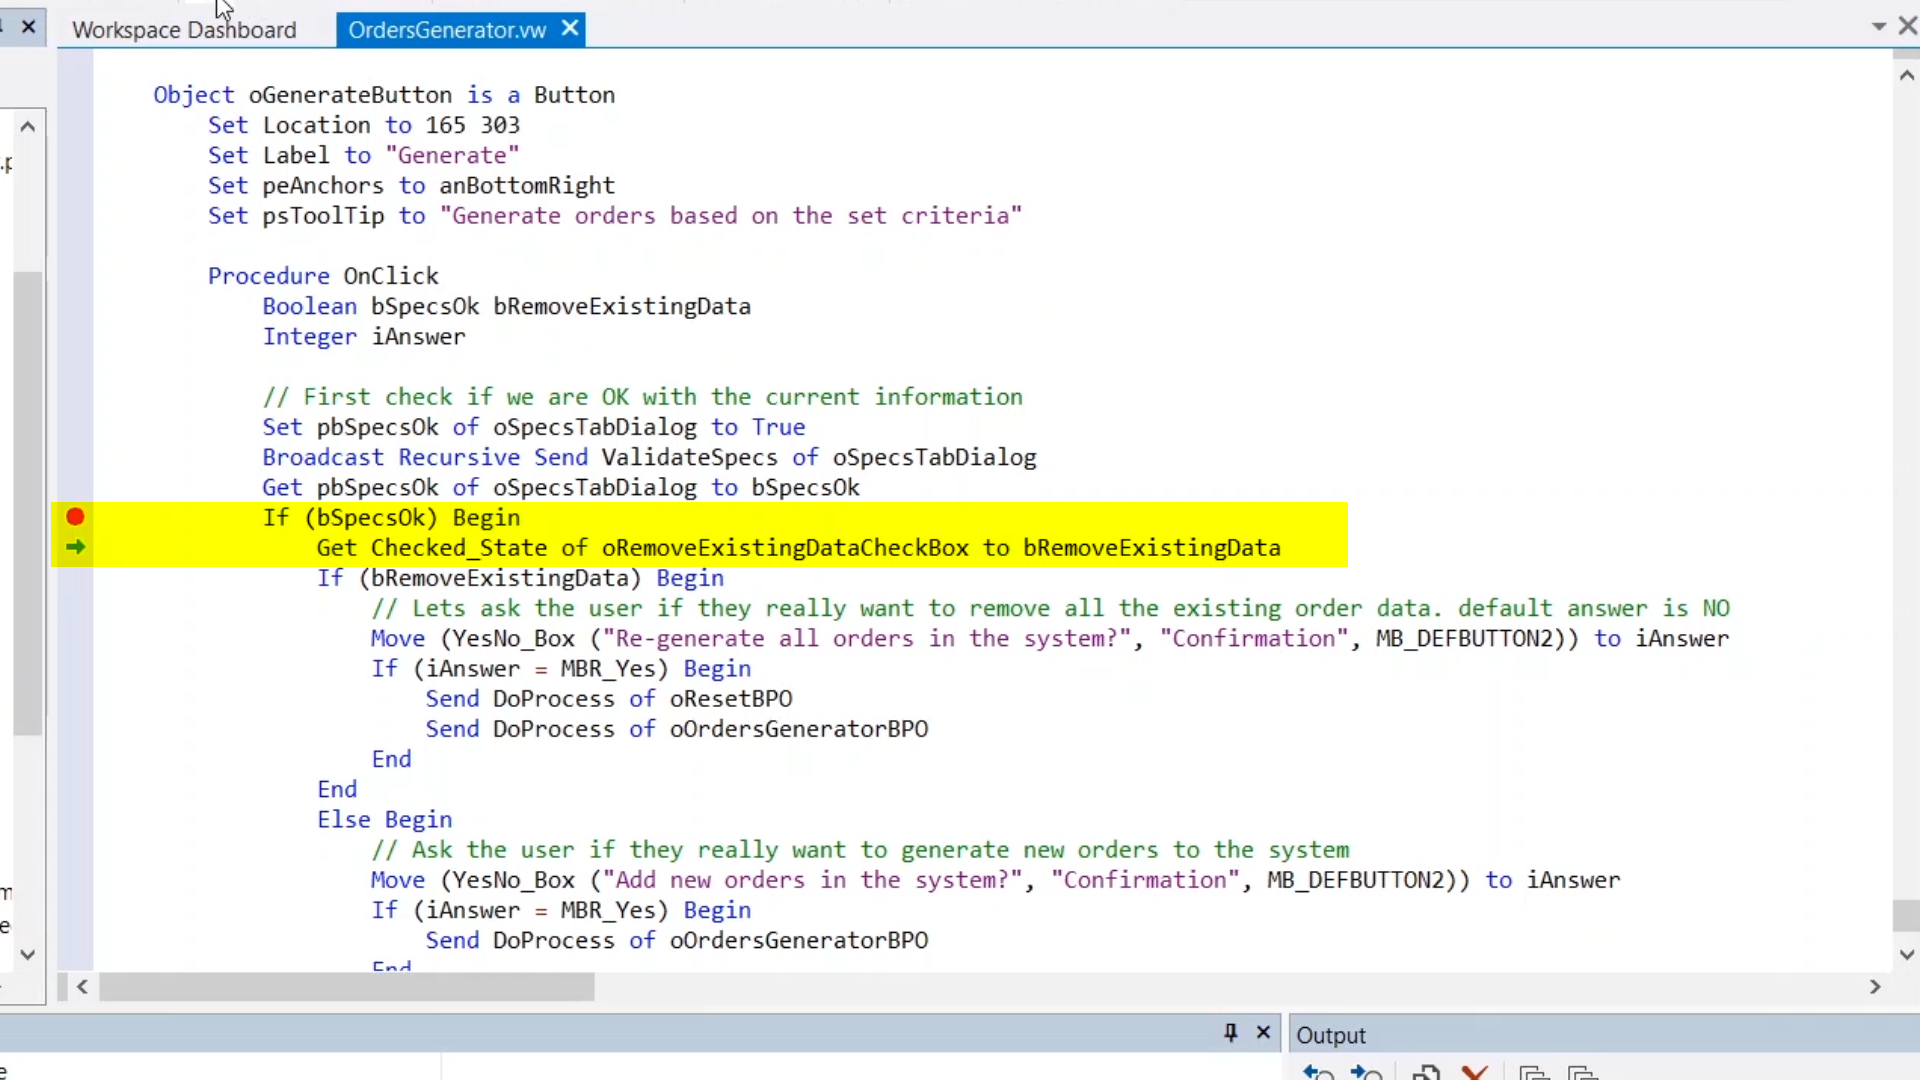
The current view shows the source code for the ‘Generate’ button that was navigated to in previous lessons, and it is currently paused where a breakpoint has been added – If (bSpeckOk) Begin
- Selecting the ‘Step Over’ icon from the top toolbar executes the current line of code, and then pauses again on the following line
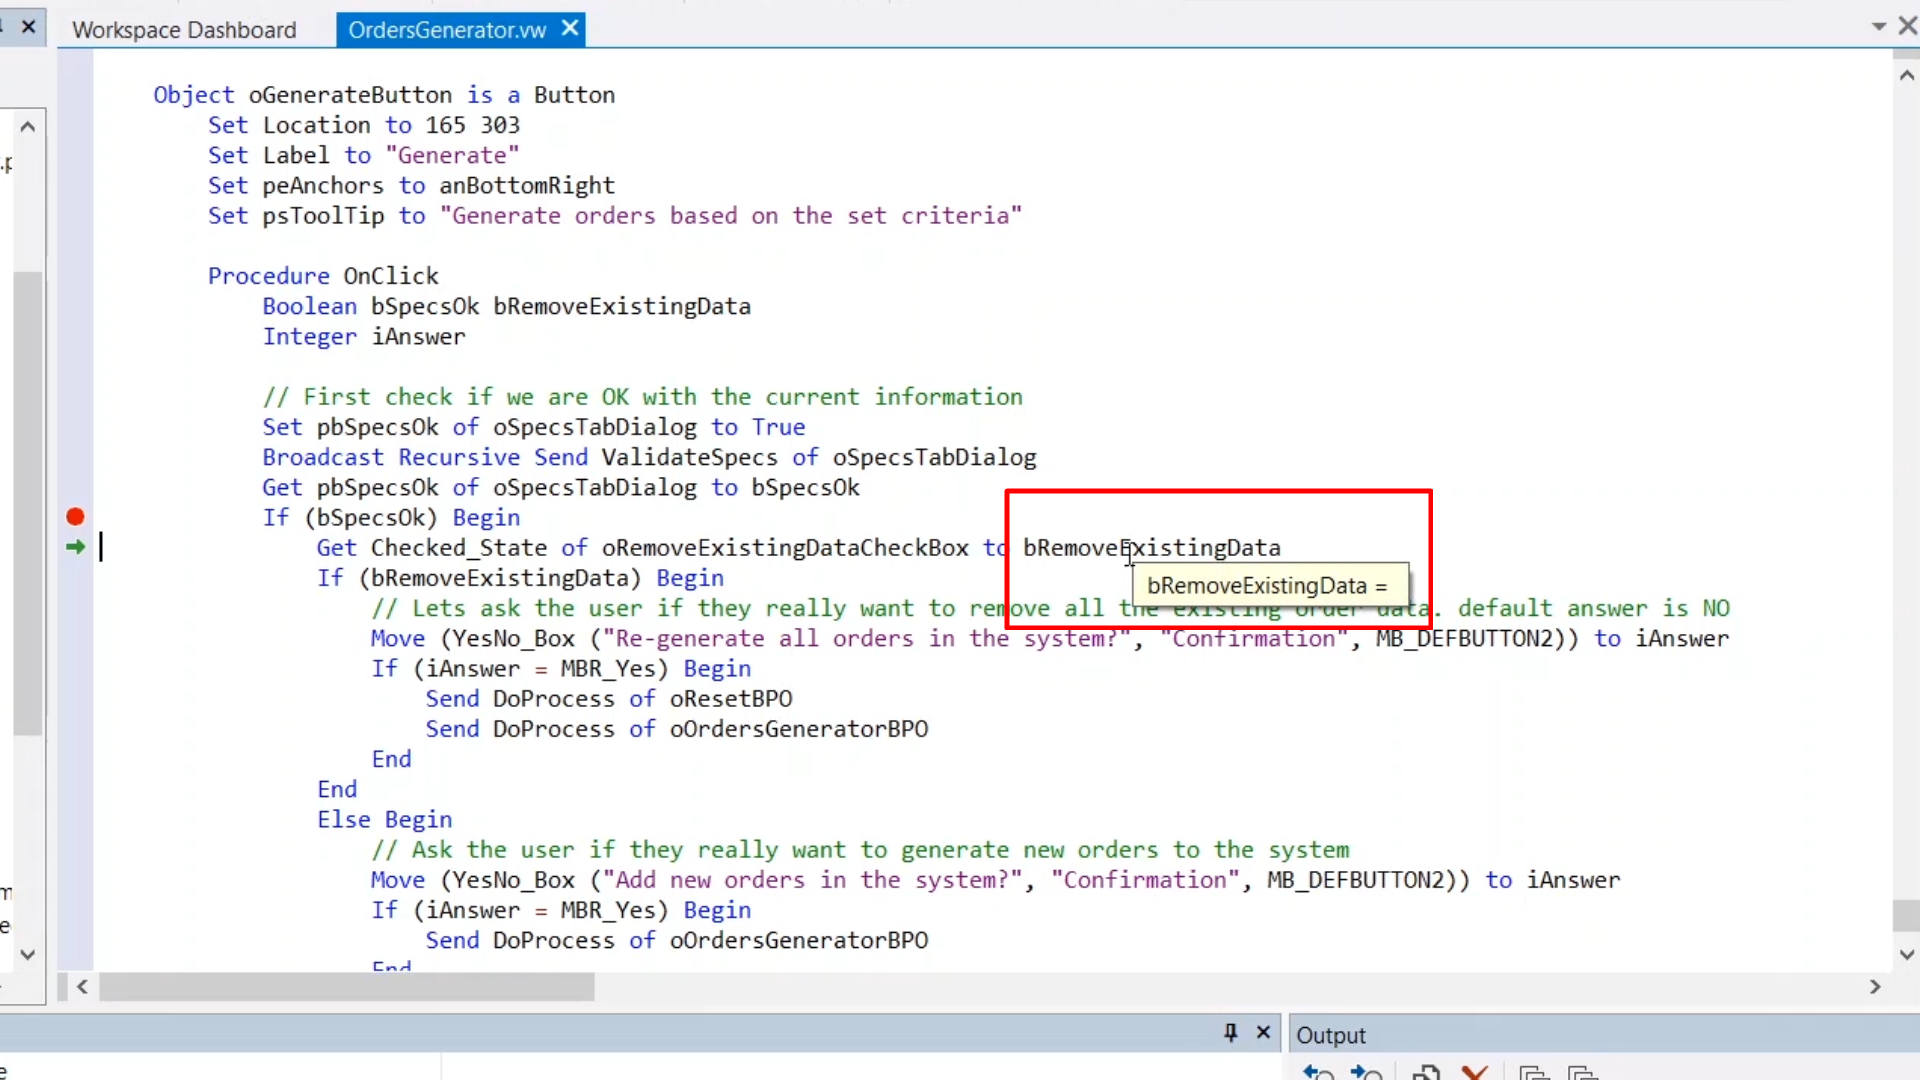
- Cursor over any item in the Code Editor for the Debugger to evaluate it
- If it’s a variable the current value will be shown
- Example: bRemoveExistingData
- When initially hovered over, it shows as blank because it has not been initialized
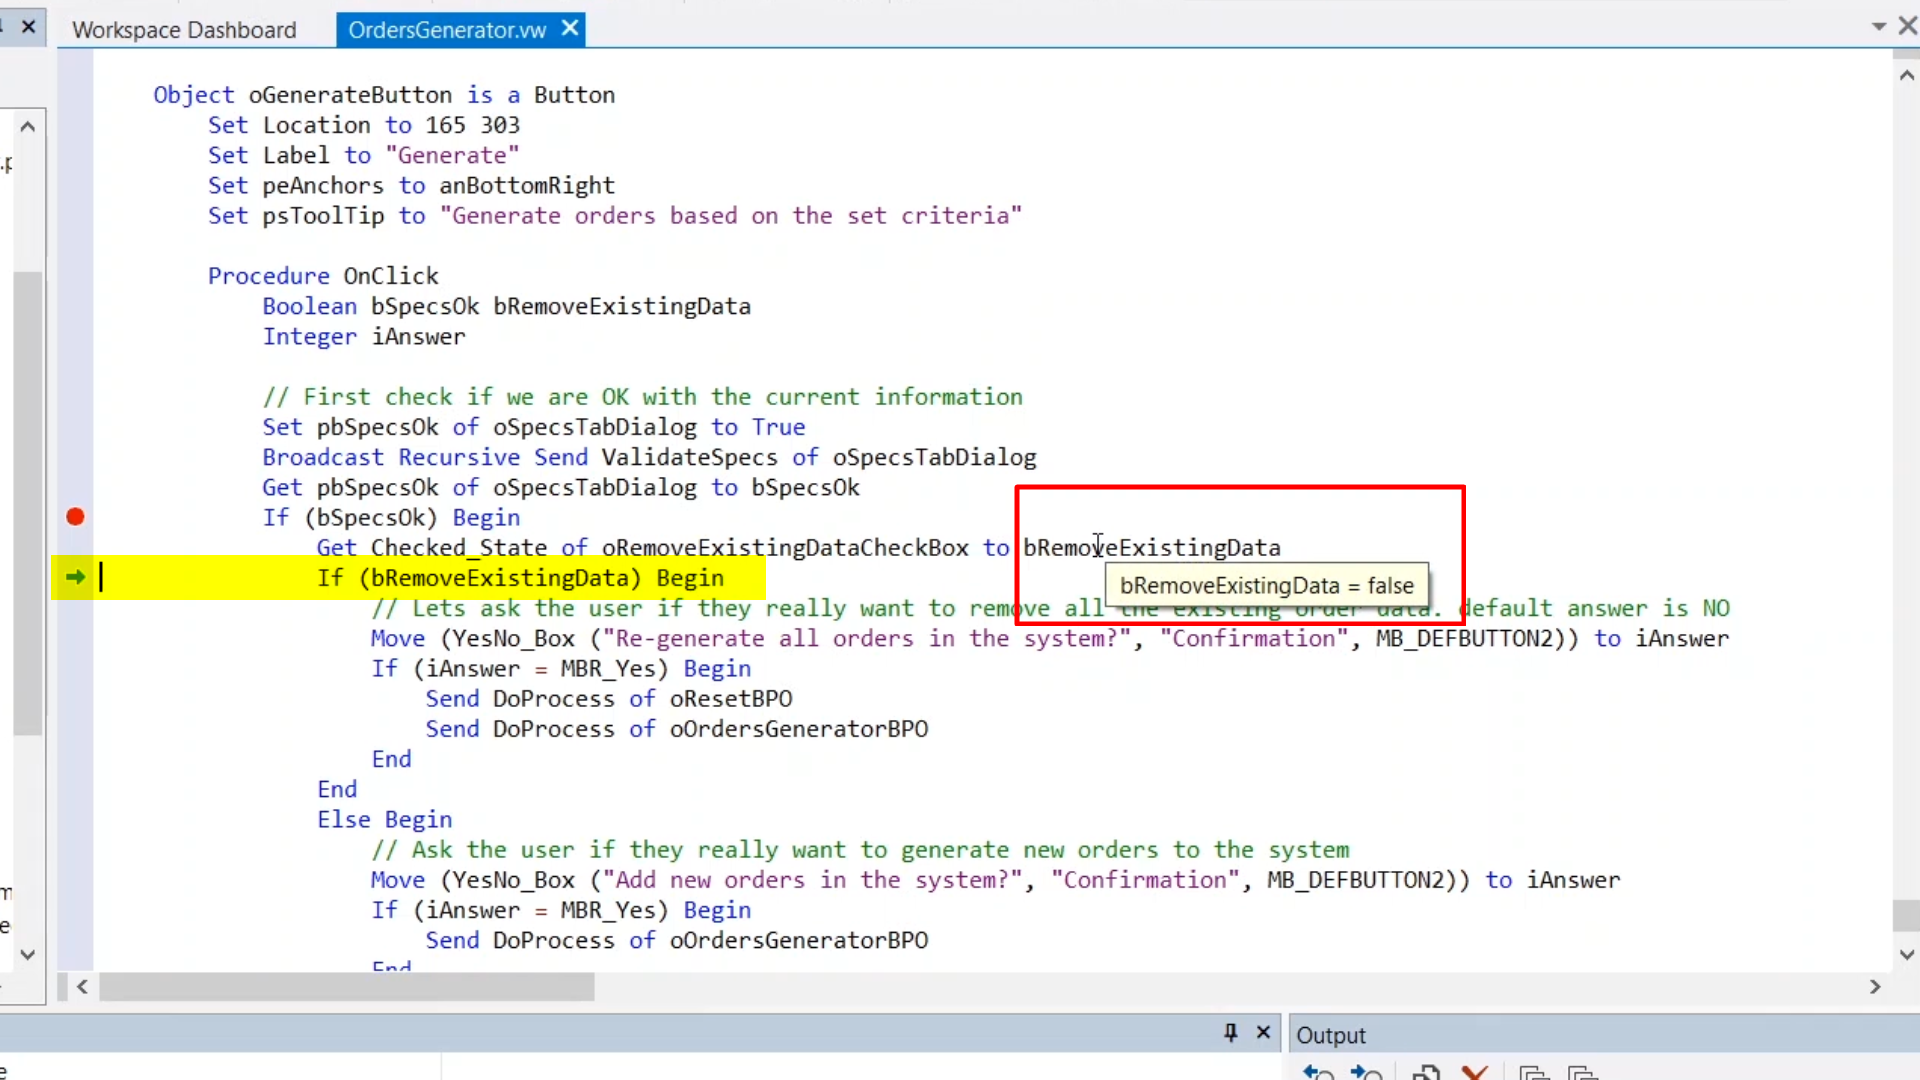
- Select the ‘Step Over’ icon again to execute the current line containing bRemoveExistingData
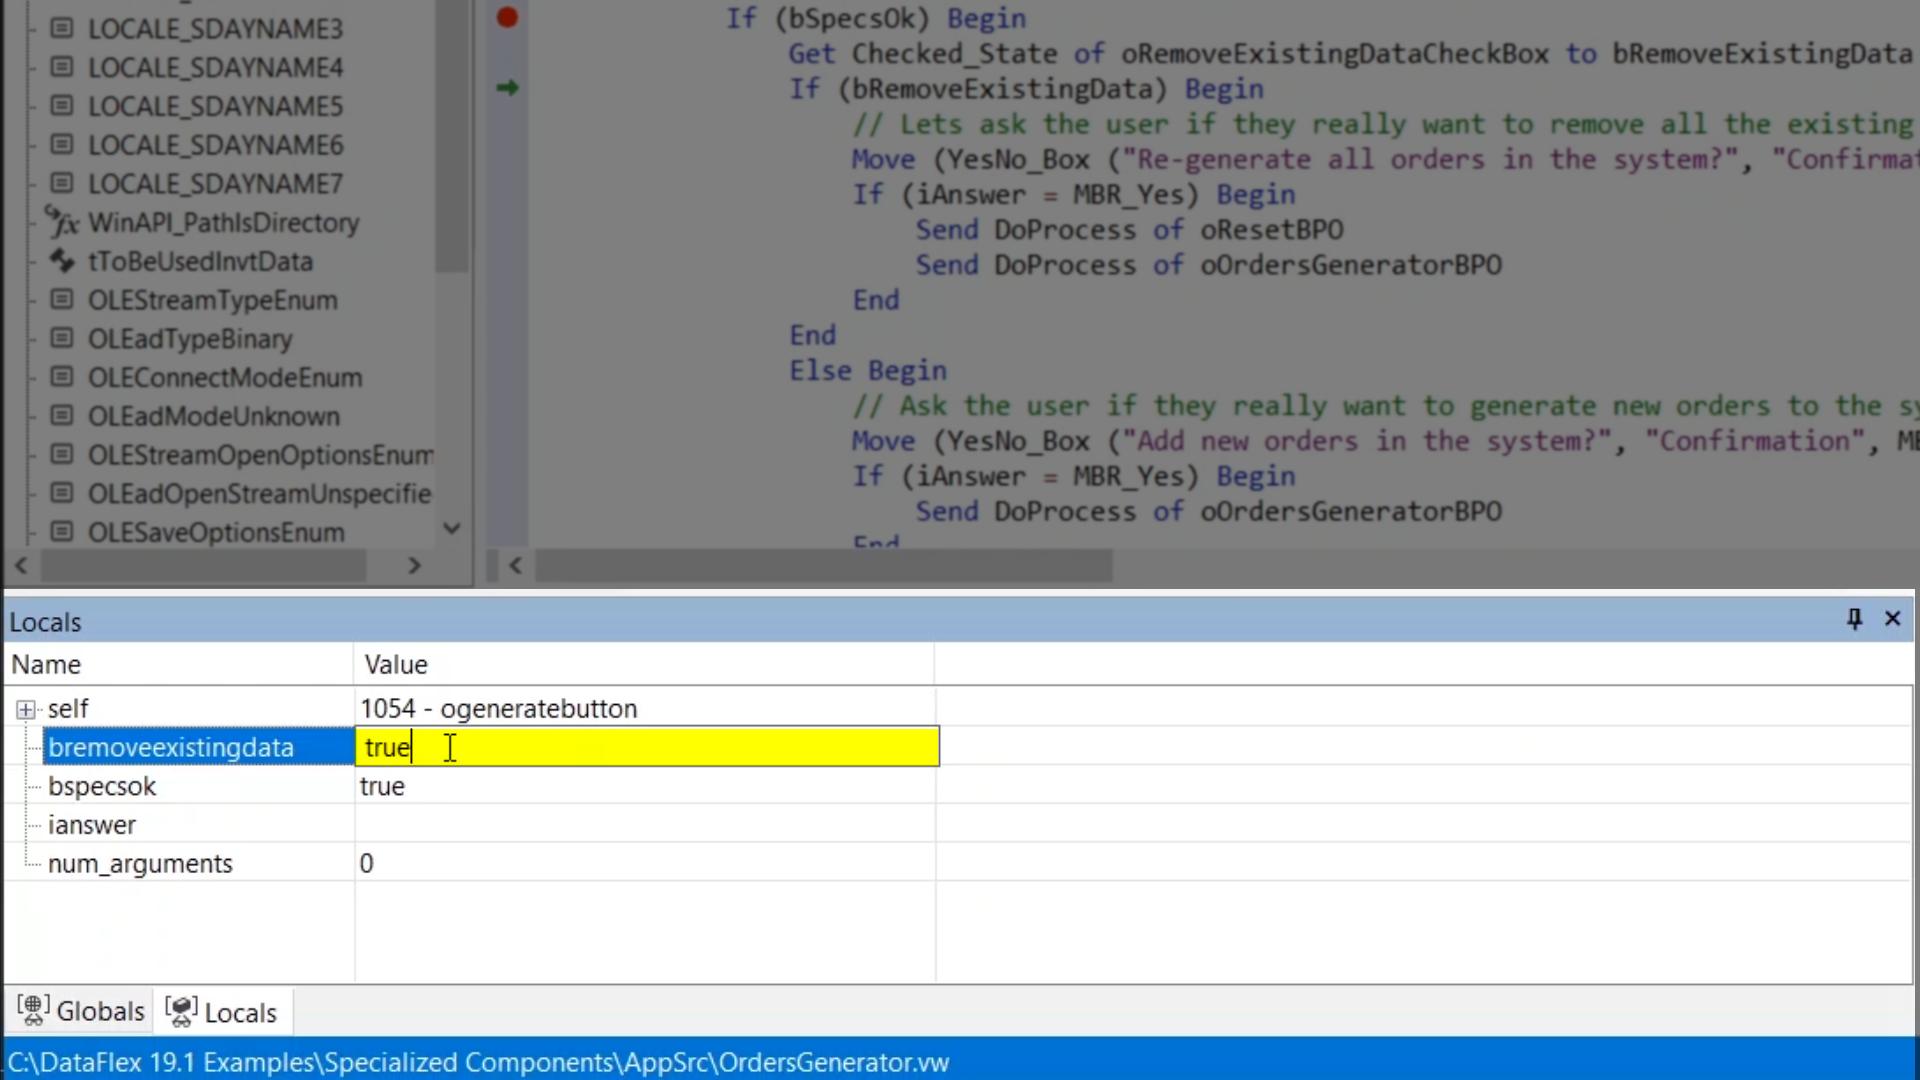
- Now when bRemoveExistingData is hovered over its value shows as ‘false’
- The value is also displayed in the Locals window, and it is red because the value has changed since the last time the Debugger was paused
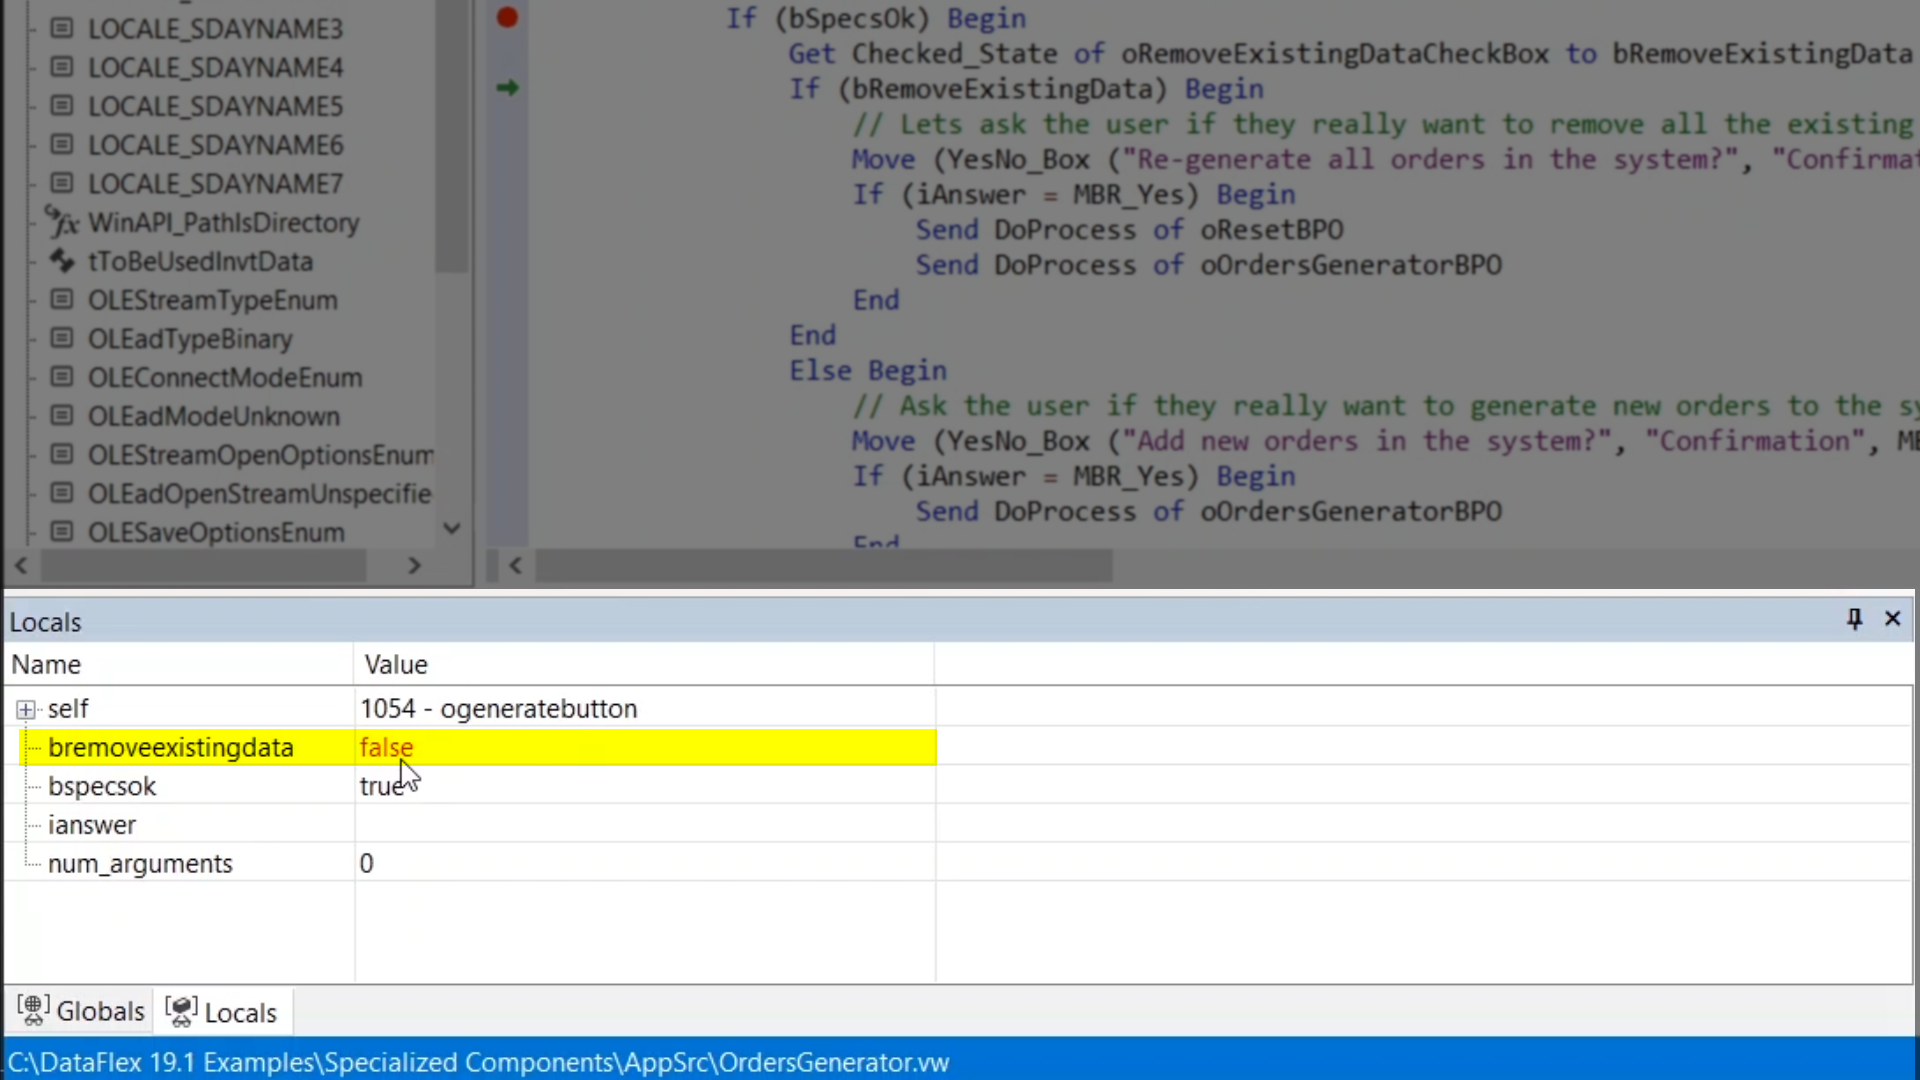
- The value of variables can be edited within the Locals window – bRemoveExistingData can be changed to ‘true’
- Selecting the ‘Step Over’ icon again causes it to step into the ‘If’ (true) block of code
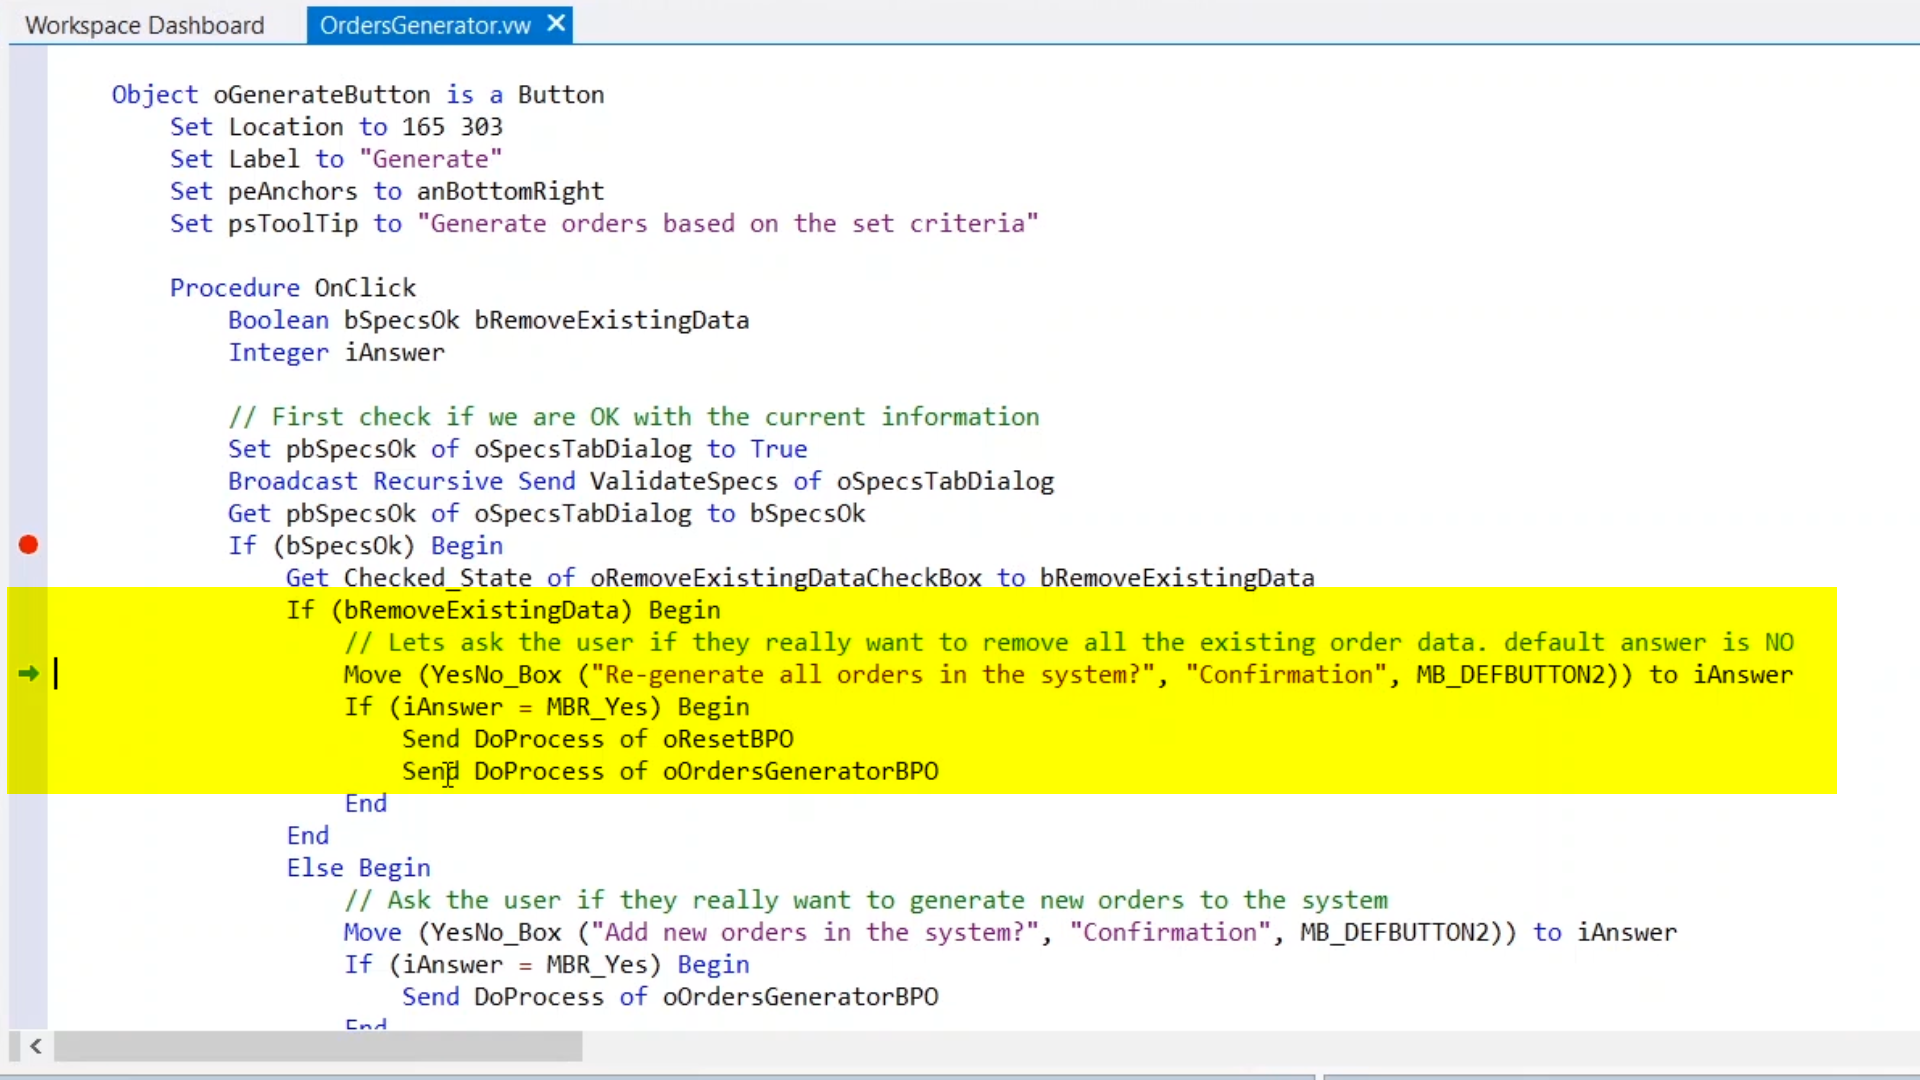
- If the value had remained false it would have stepped into the ‘Else’ (false) block of code
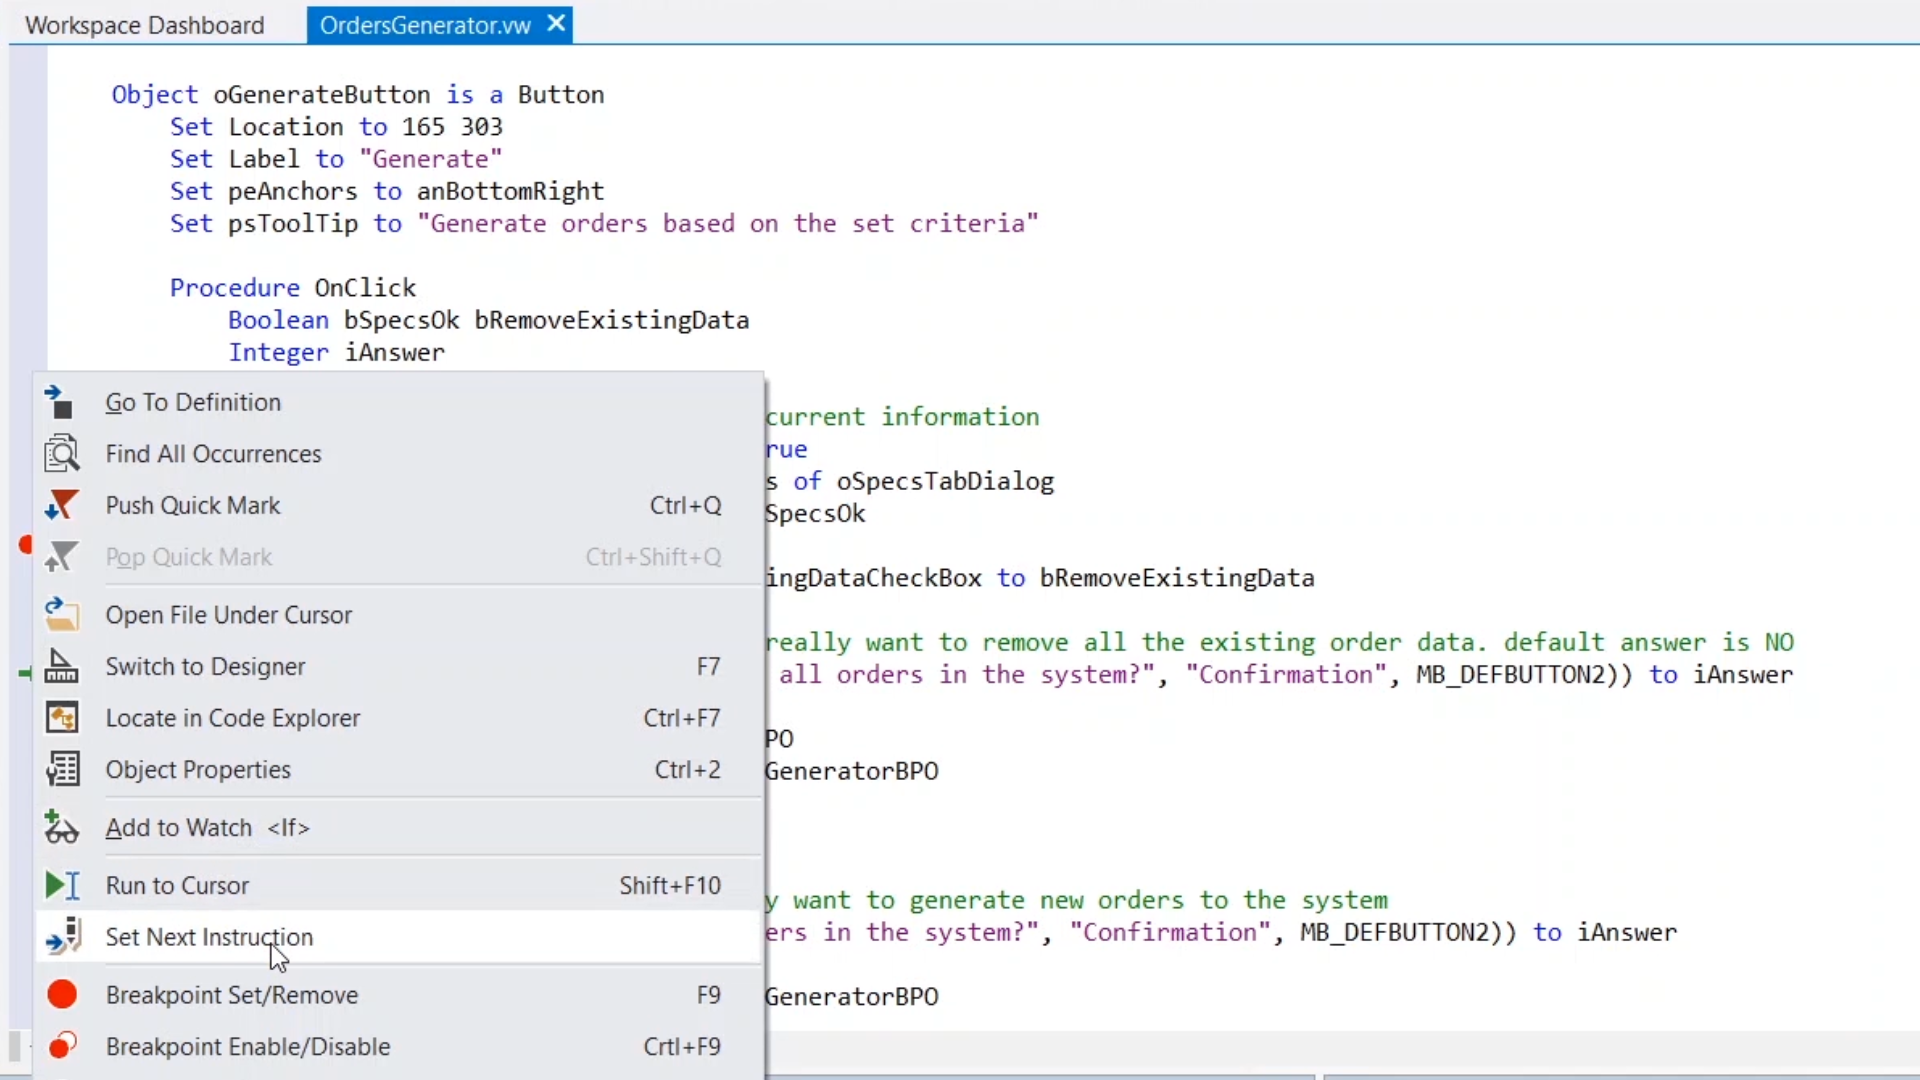
- To re-execute the if statement using the variable’s original value of ‘false’ …
- Right-click in the left margin next to the line of code that is to be re-executed, and select ‘Set Next Instruction’ to change the current line in the Debugger to that line
- In the Locals window, change the value of bRemoveExistingData back to ‘false’
- Now selecting the ‘Step Over’ icon again causes it to step into the ‘Else’ (false) block of code
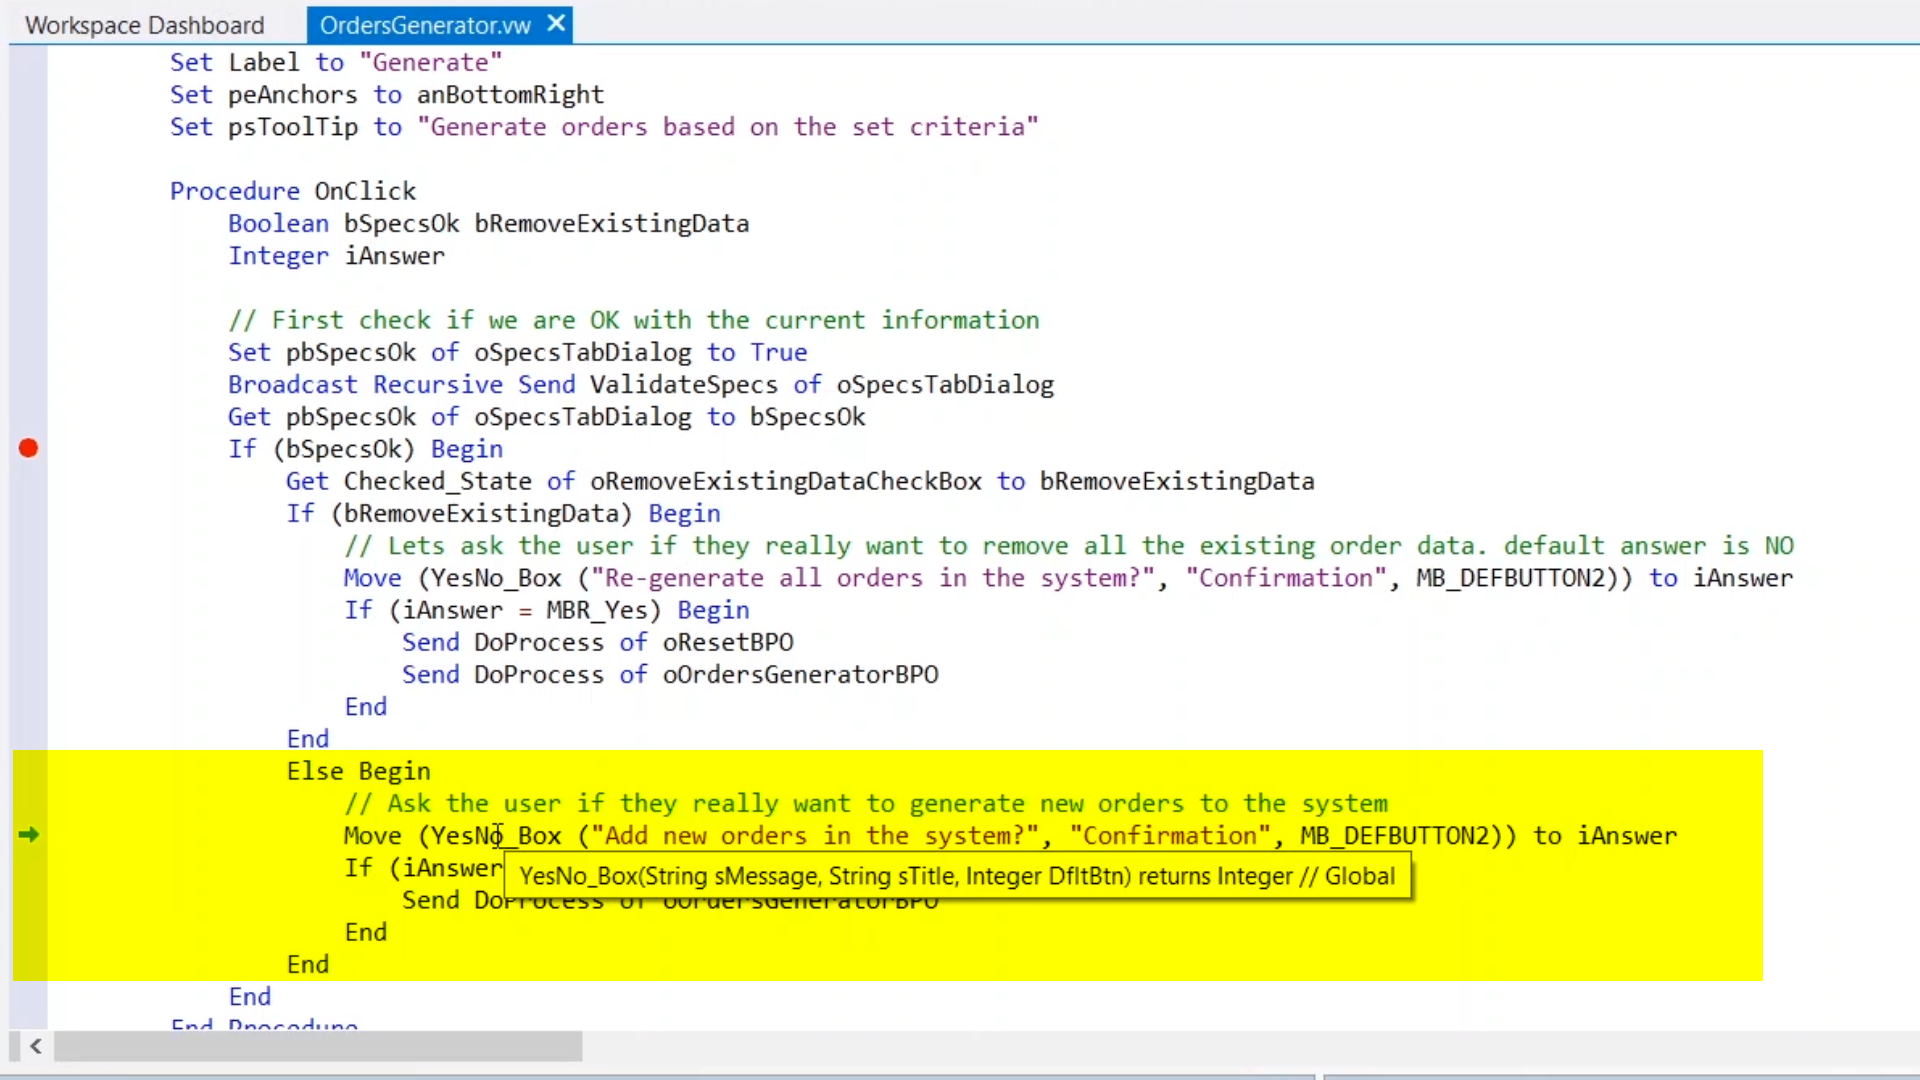
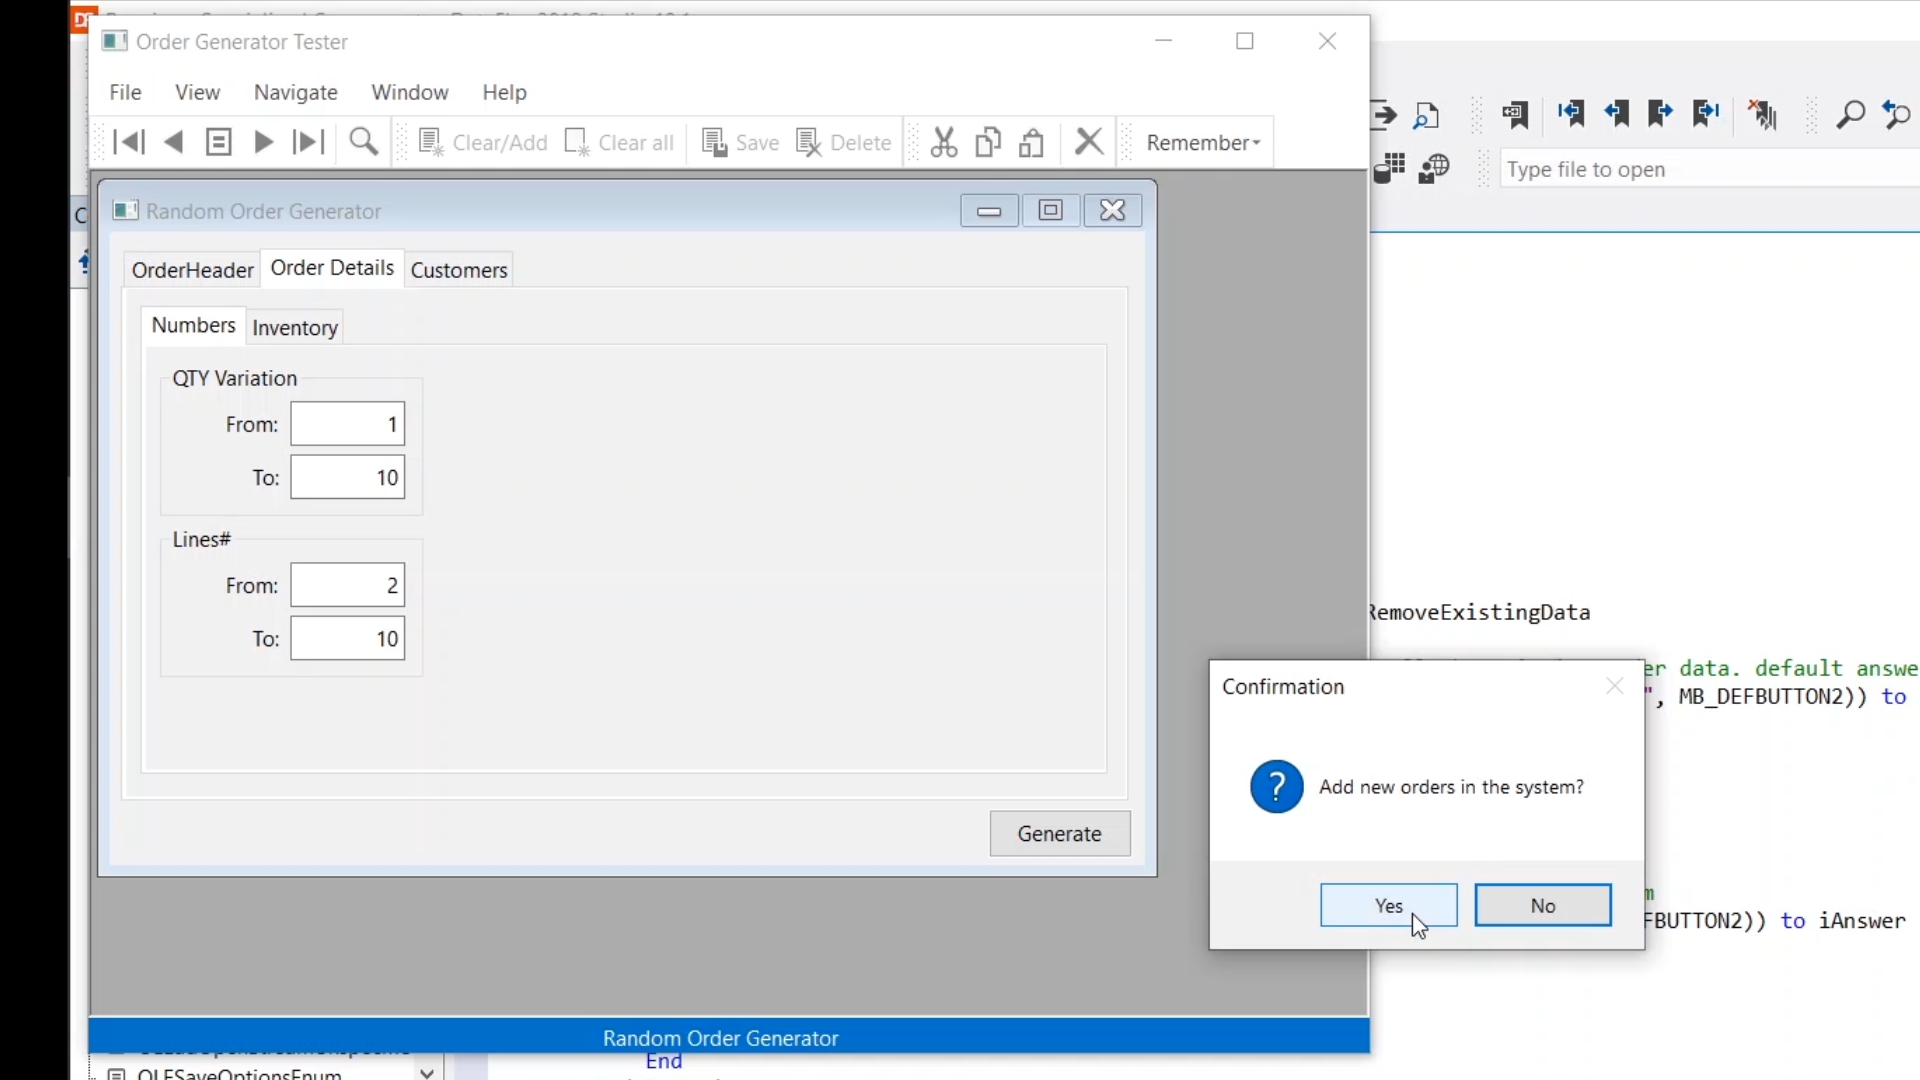
- The next line of code in the program displays a ‘Yes/No’ message box to the user and asks for user input
- If the ‘Step Over’ icon is selected again the execution does not return to the Debugger because the program has displayed the message box, and is awaiting user input
- Selecting ‘Yes’ from the running program results in the Debugger being paused on the next line of code
- Hovering over the return value variable, iAnswer, and the constant, MBR_Yes, to see that both values are ‘6’
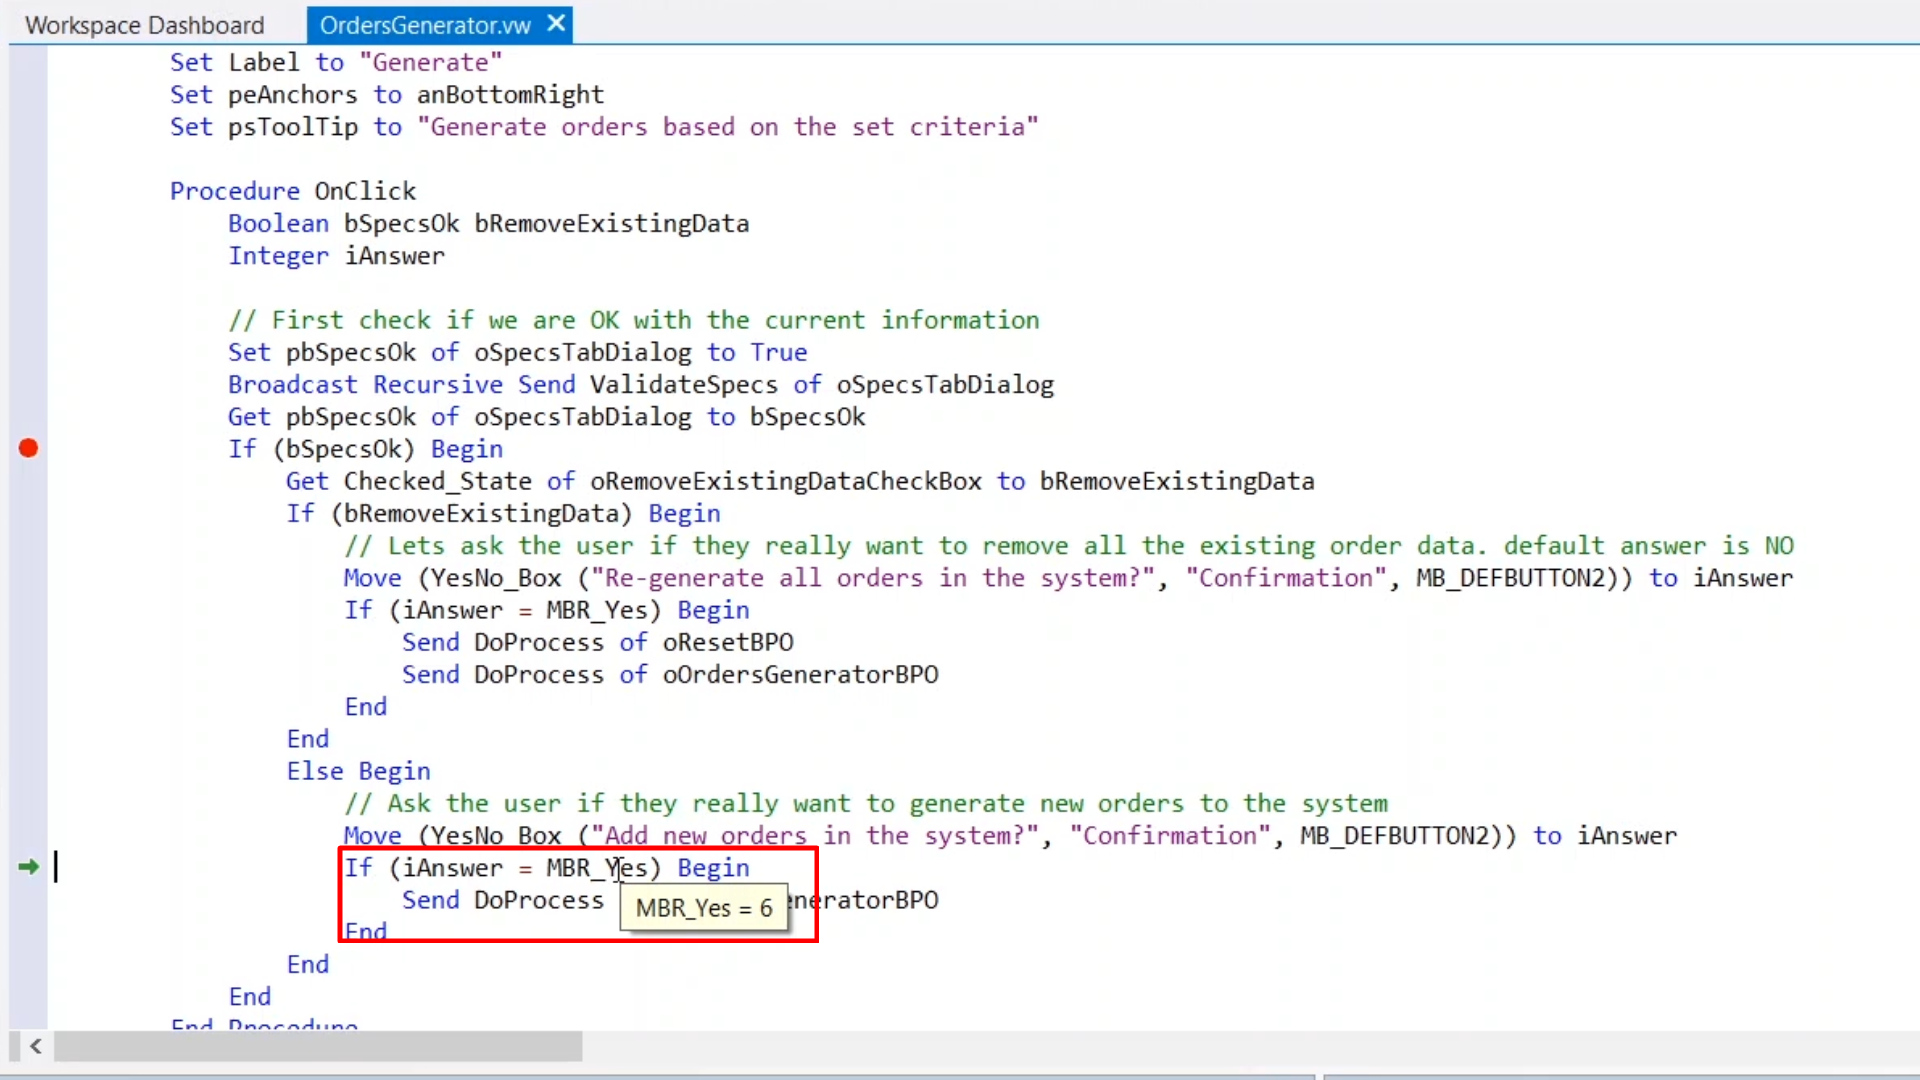
- Stepping over that line to execute the If statement to the next, which calls the DoProcess method of the oOrdersGeneratorBPO object
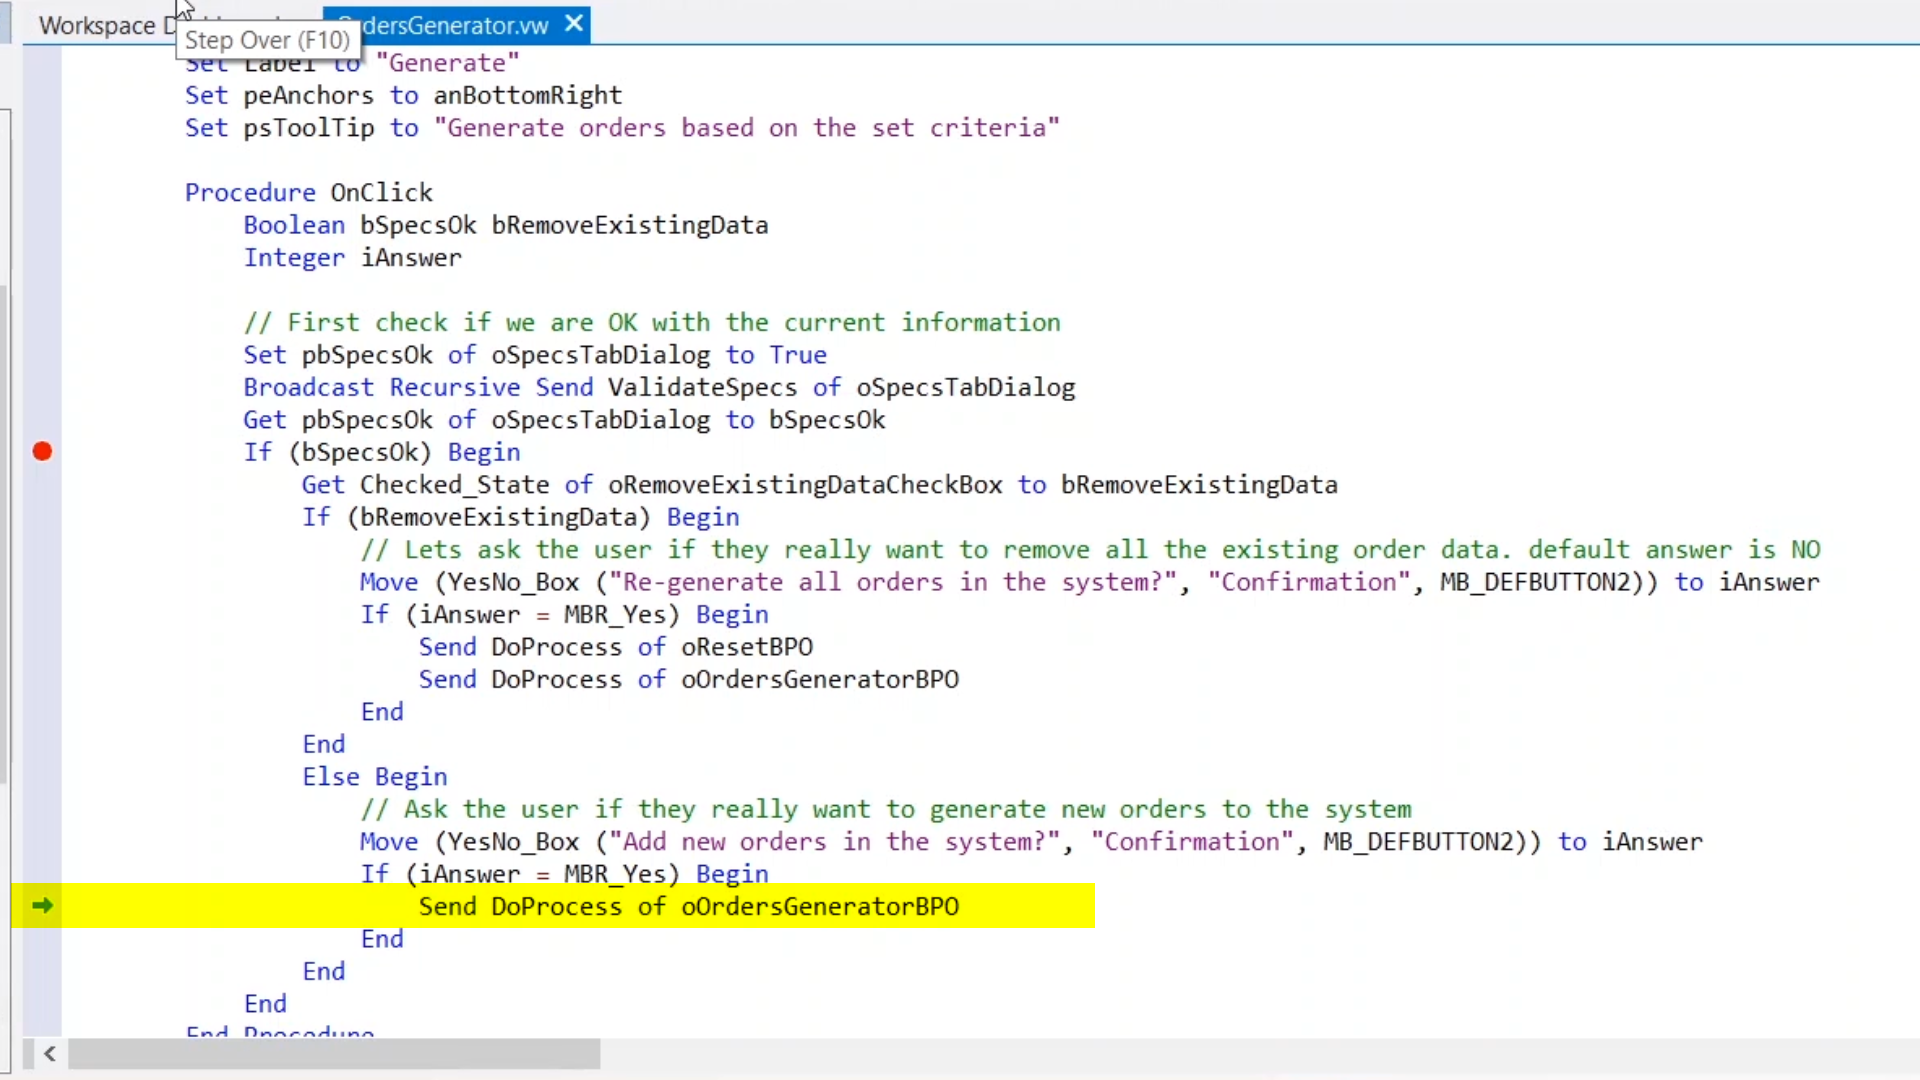
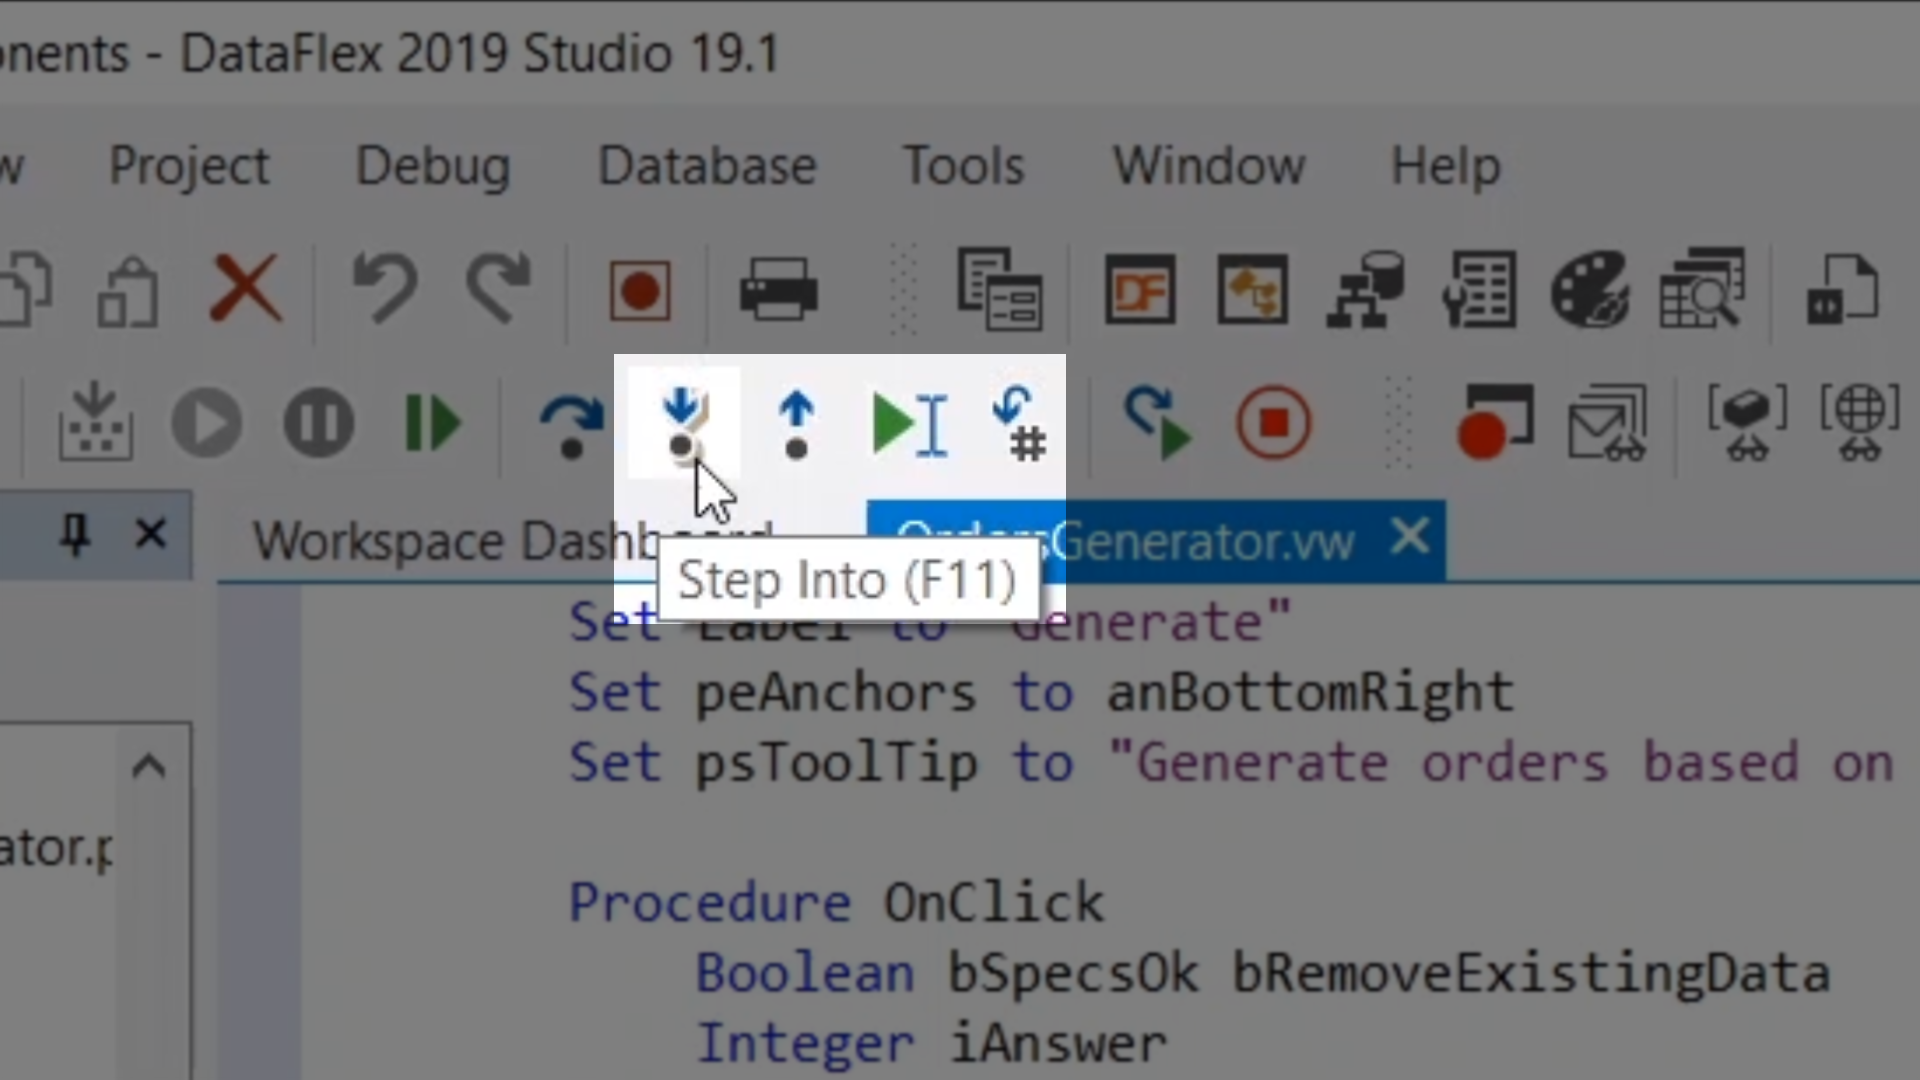
- Clicking the Step Into icon here moves the execution into the DoProcess method
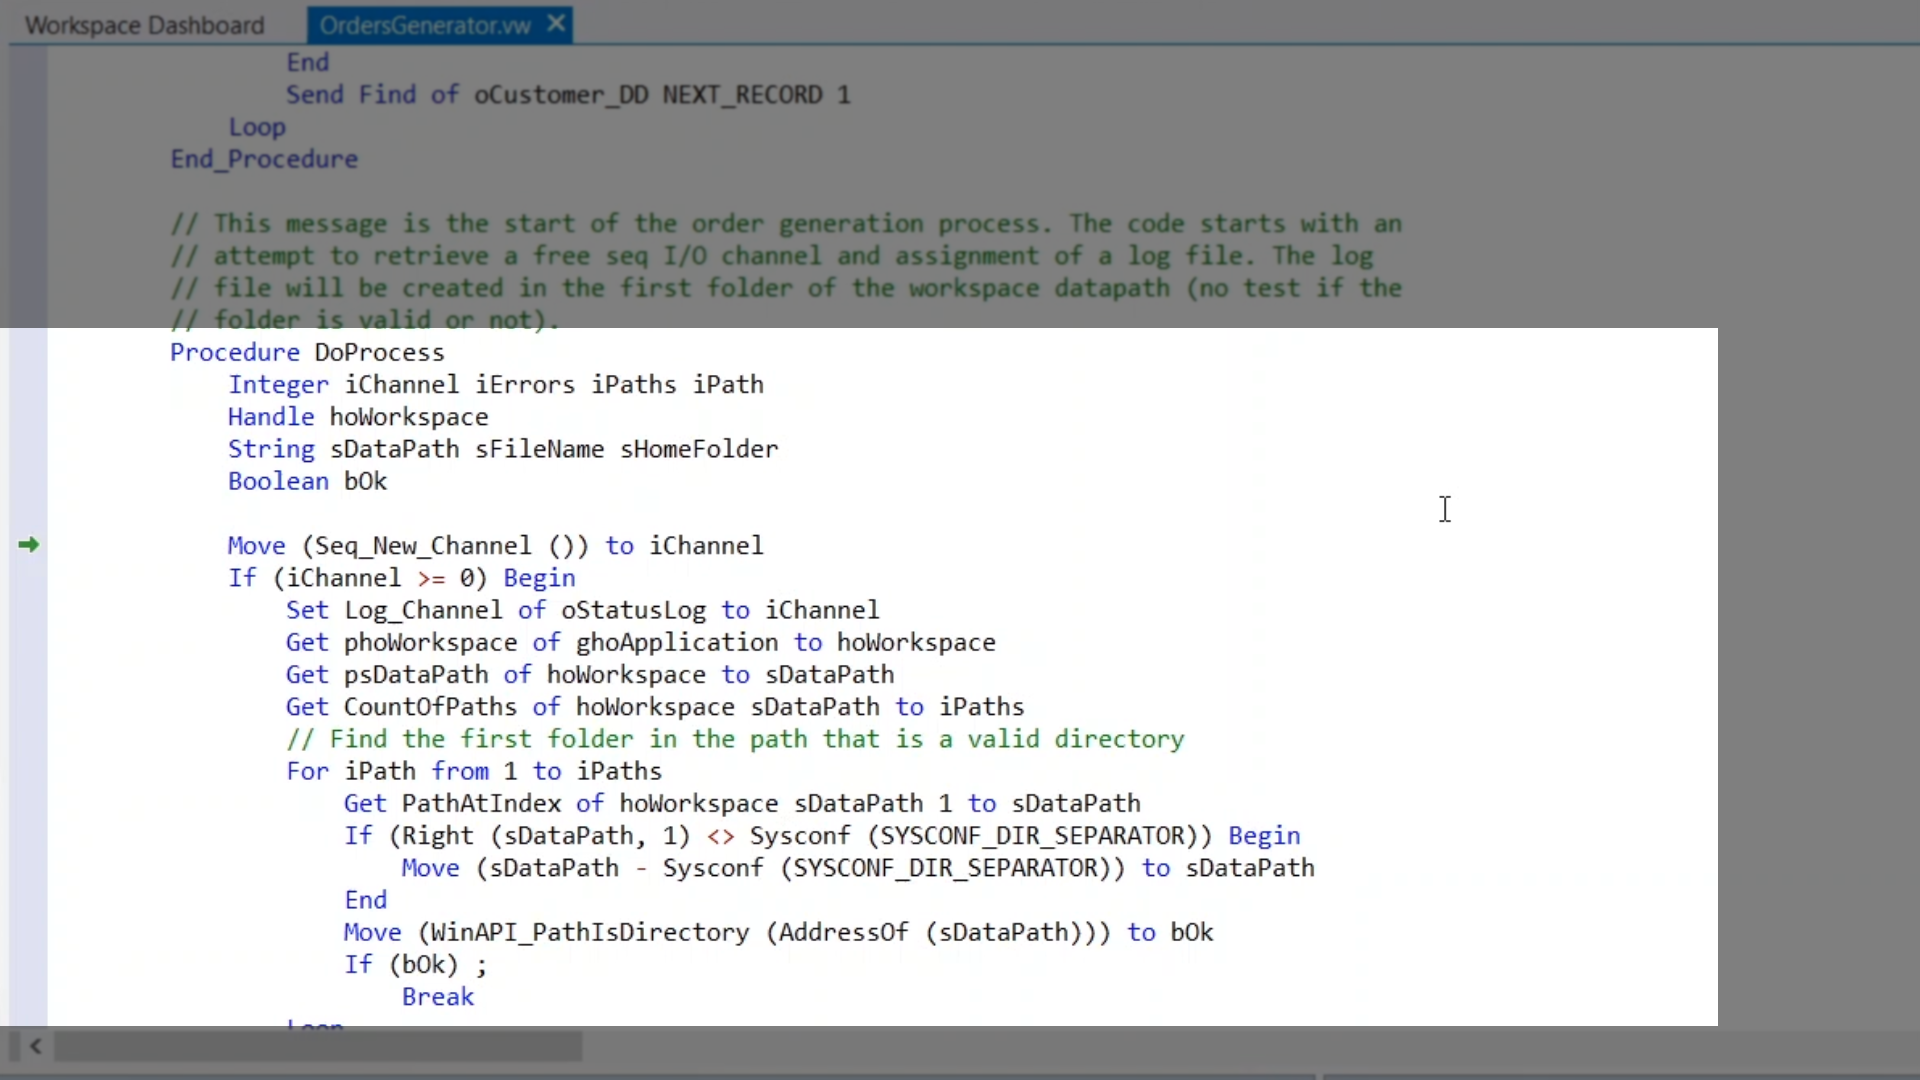
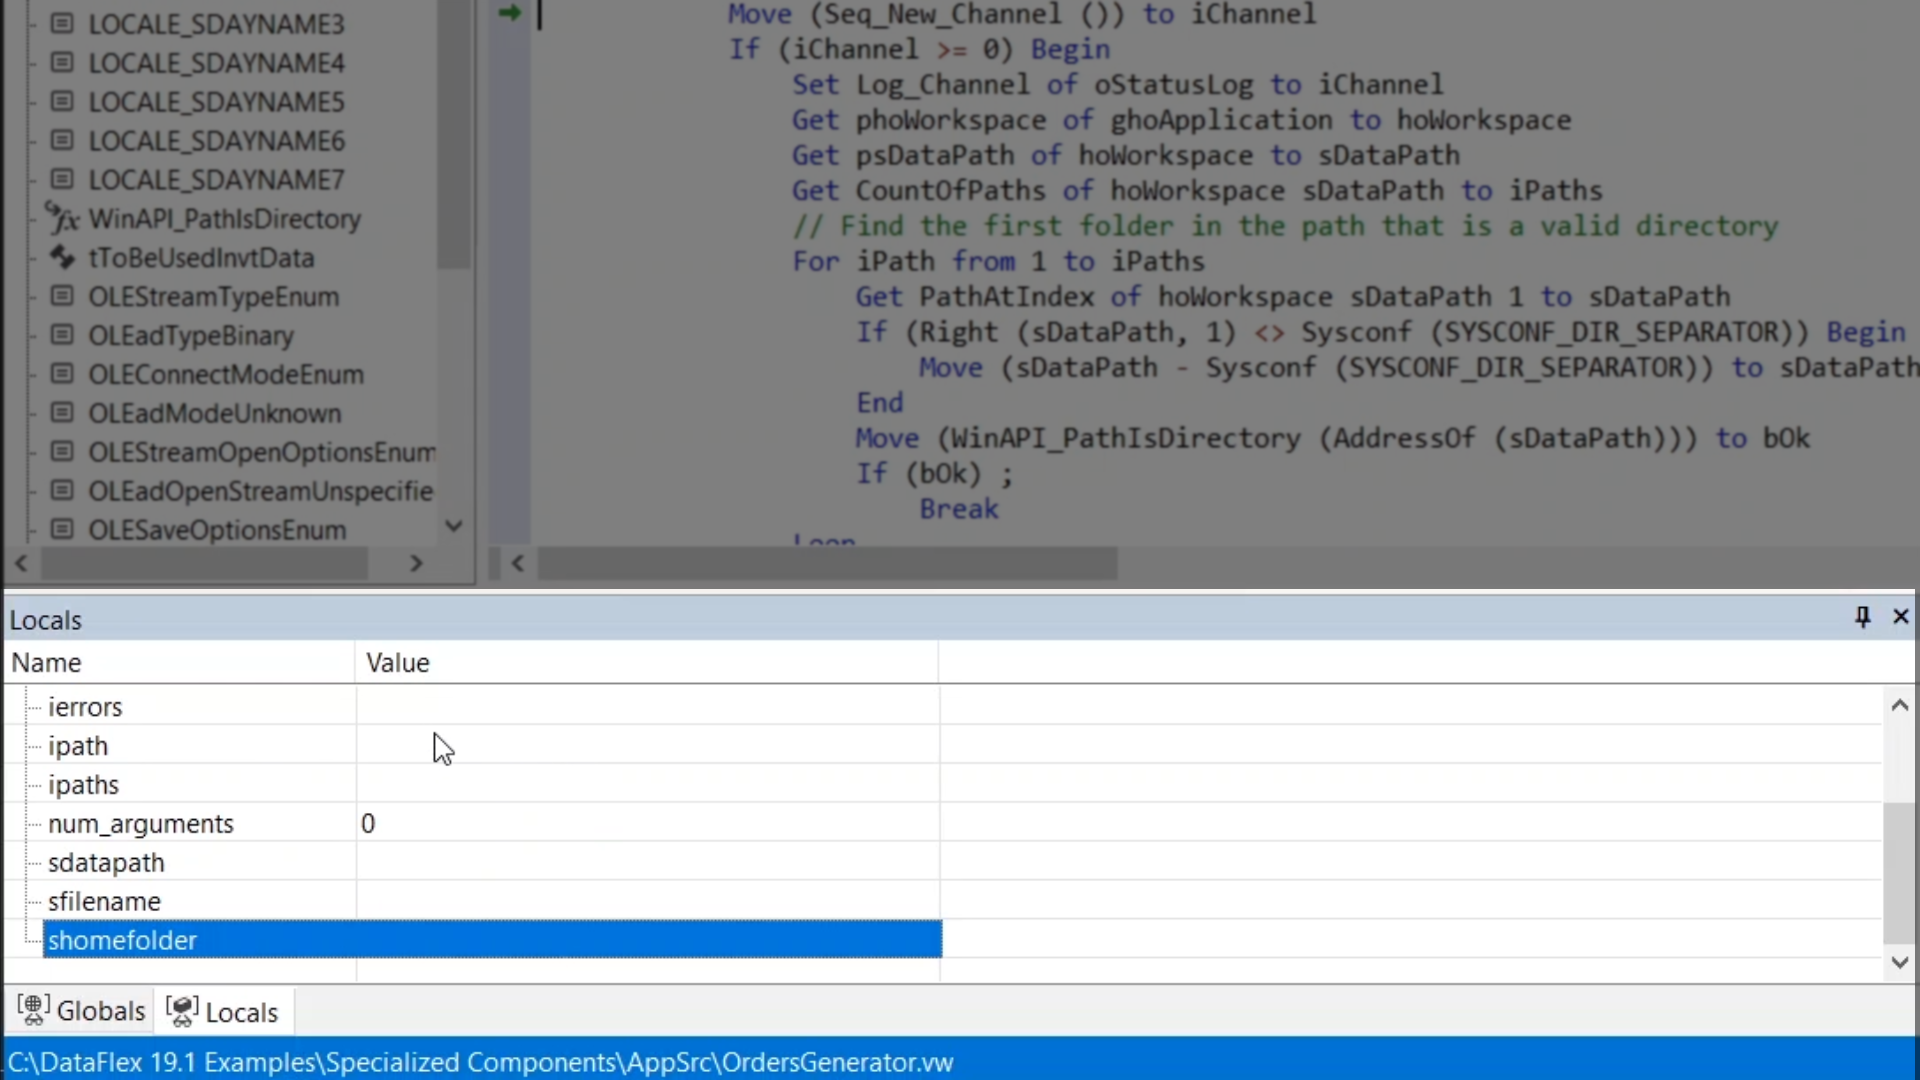
- Note that the contents of the Locals window have changed to the new context, which is the DoProcess method
- The ‘Call Stack’ panel on the right contains the list of nested methods the program has called
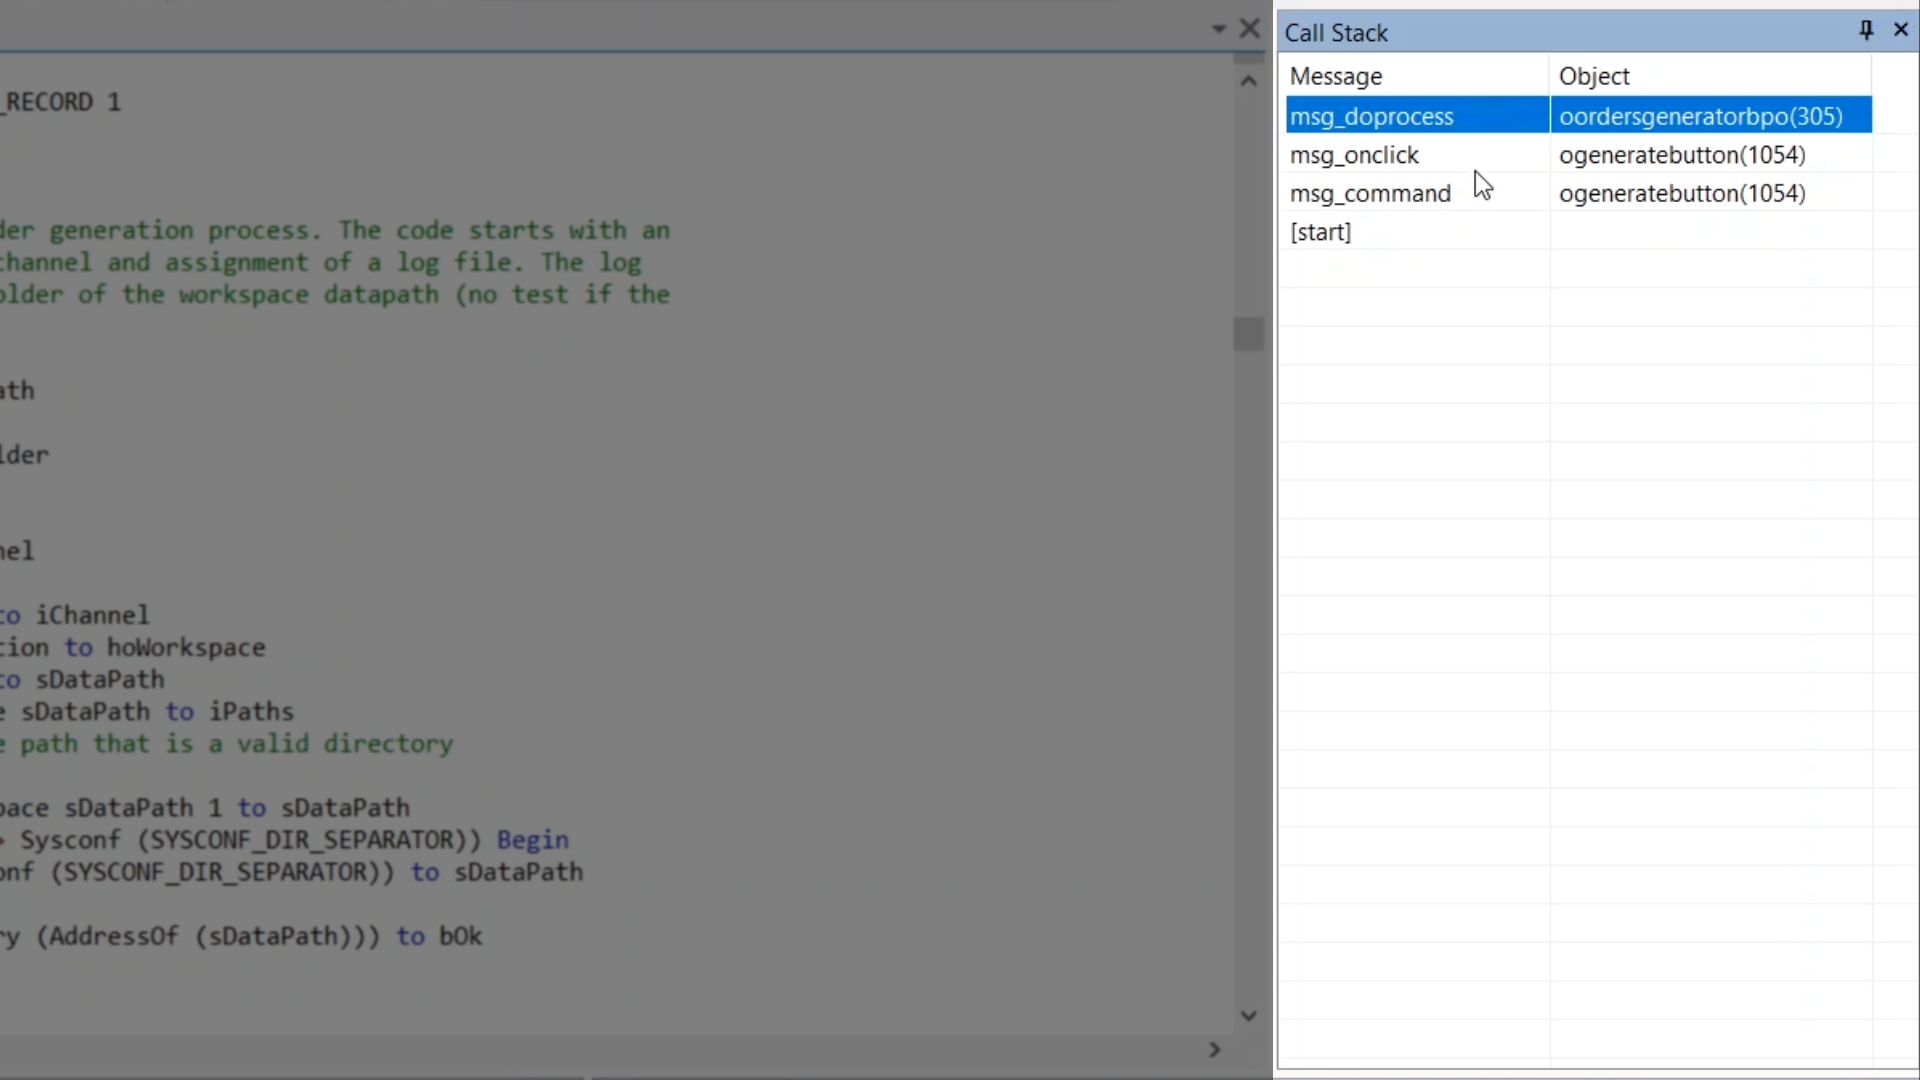
- Clicking on any method in the list will cause the context of Debugger and all associated windows will change to that method
- If other methods are viewed, the program will remain paused in DoProcess
- Clicking on the top item in the ‘Call Stack’ will return the view back to where the program is currently paused


