To continue with this content, please log in with your Data Access ID or create a new account.
Cancel Data Access ID
You may not be authorized to see this content. Please contact Data Access Europe for more information.
Cancel Data Access Europe
You are not authorized to see this content.
Cancel Data Access Europe
Next lesson:
Debugging Tips and Tricks
Cancel

Debugging DataFlex Apps

Lesson 10: Debugging WebApps

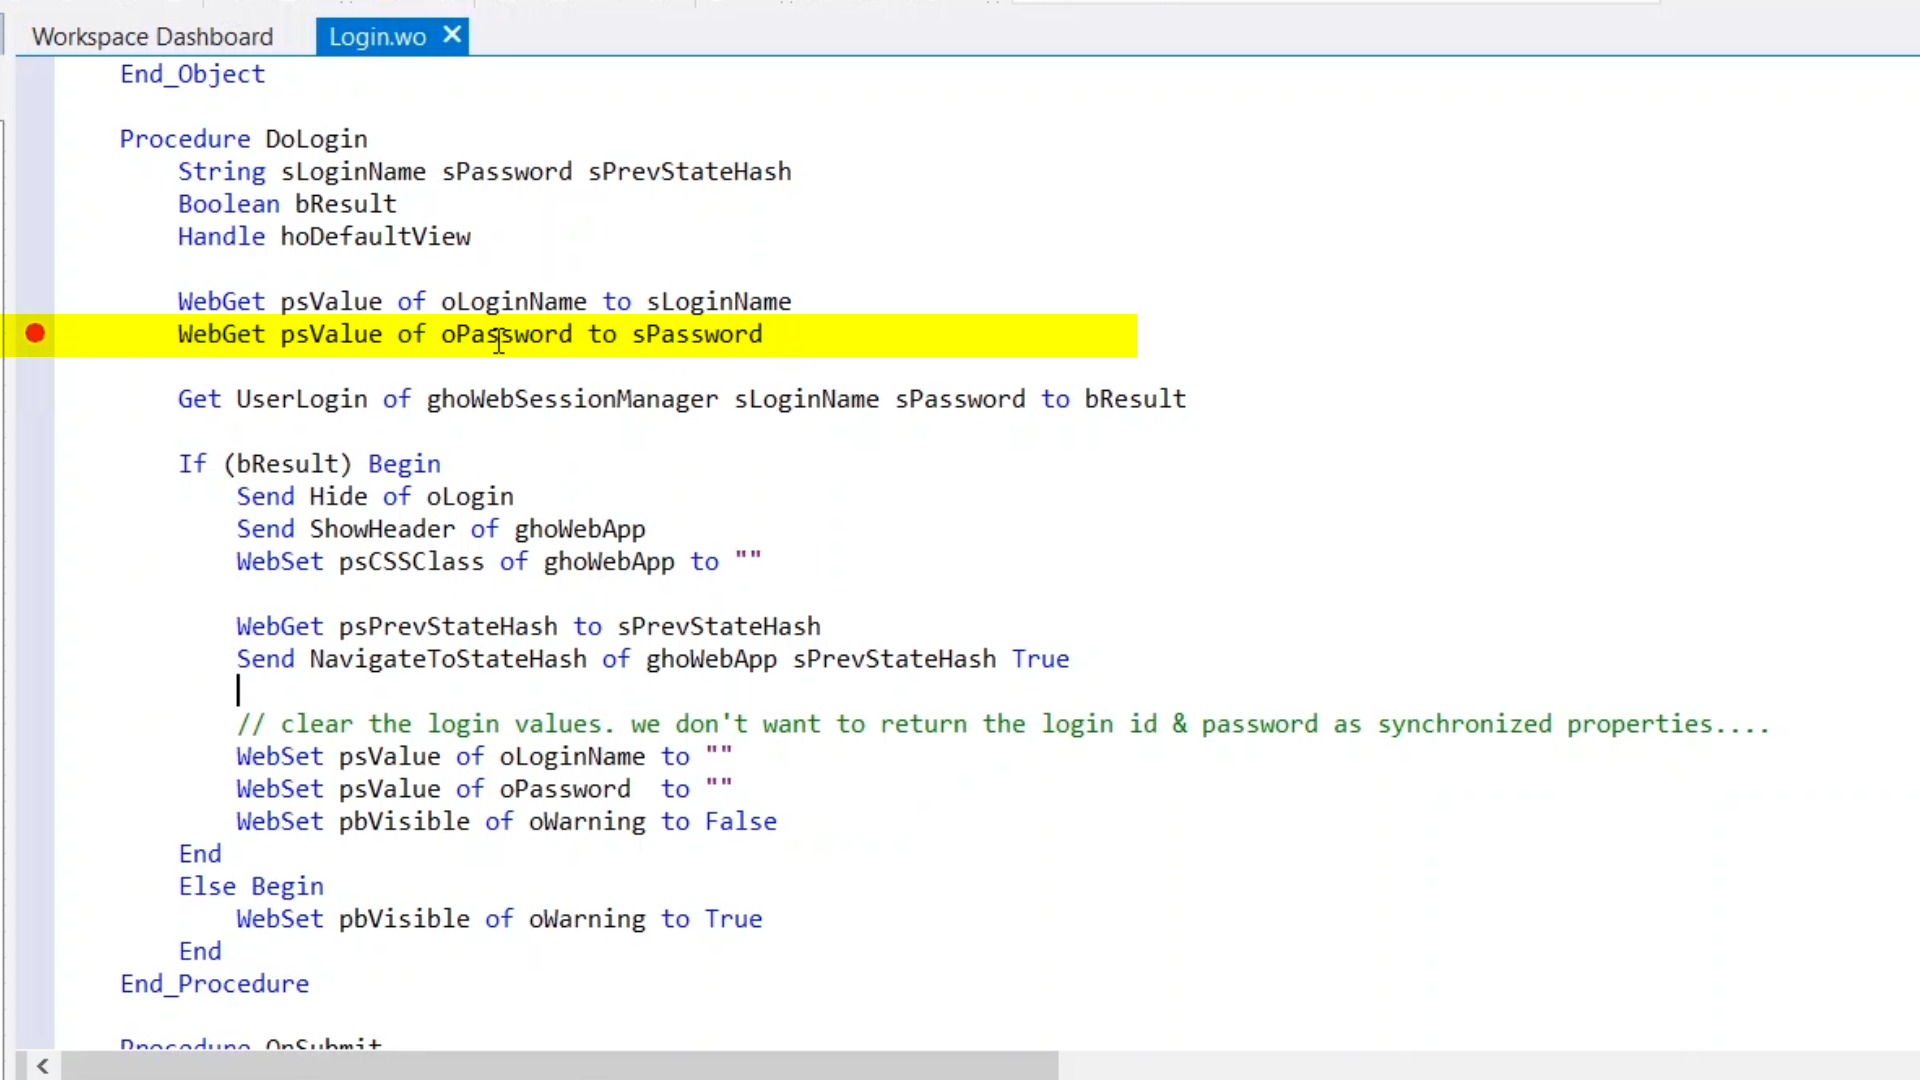
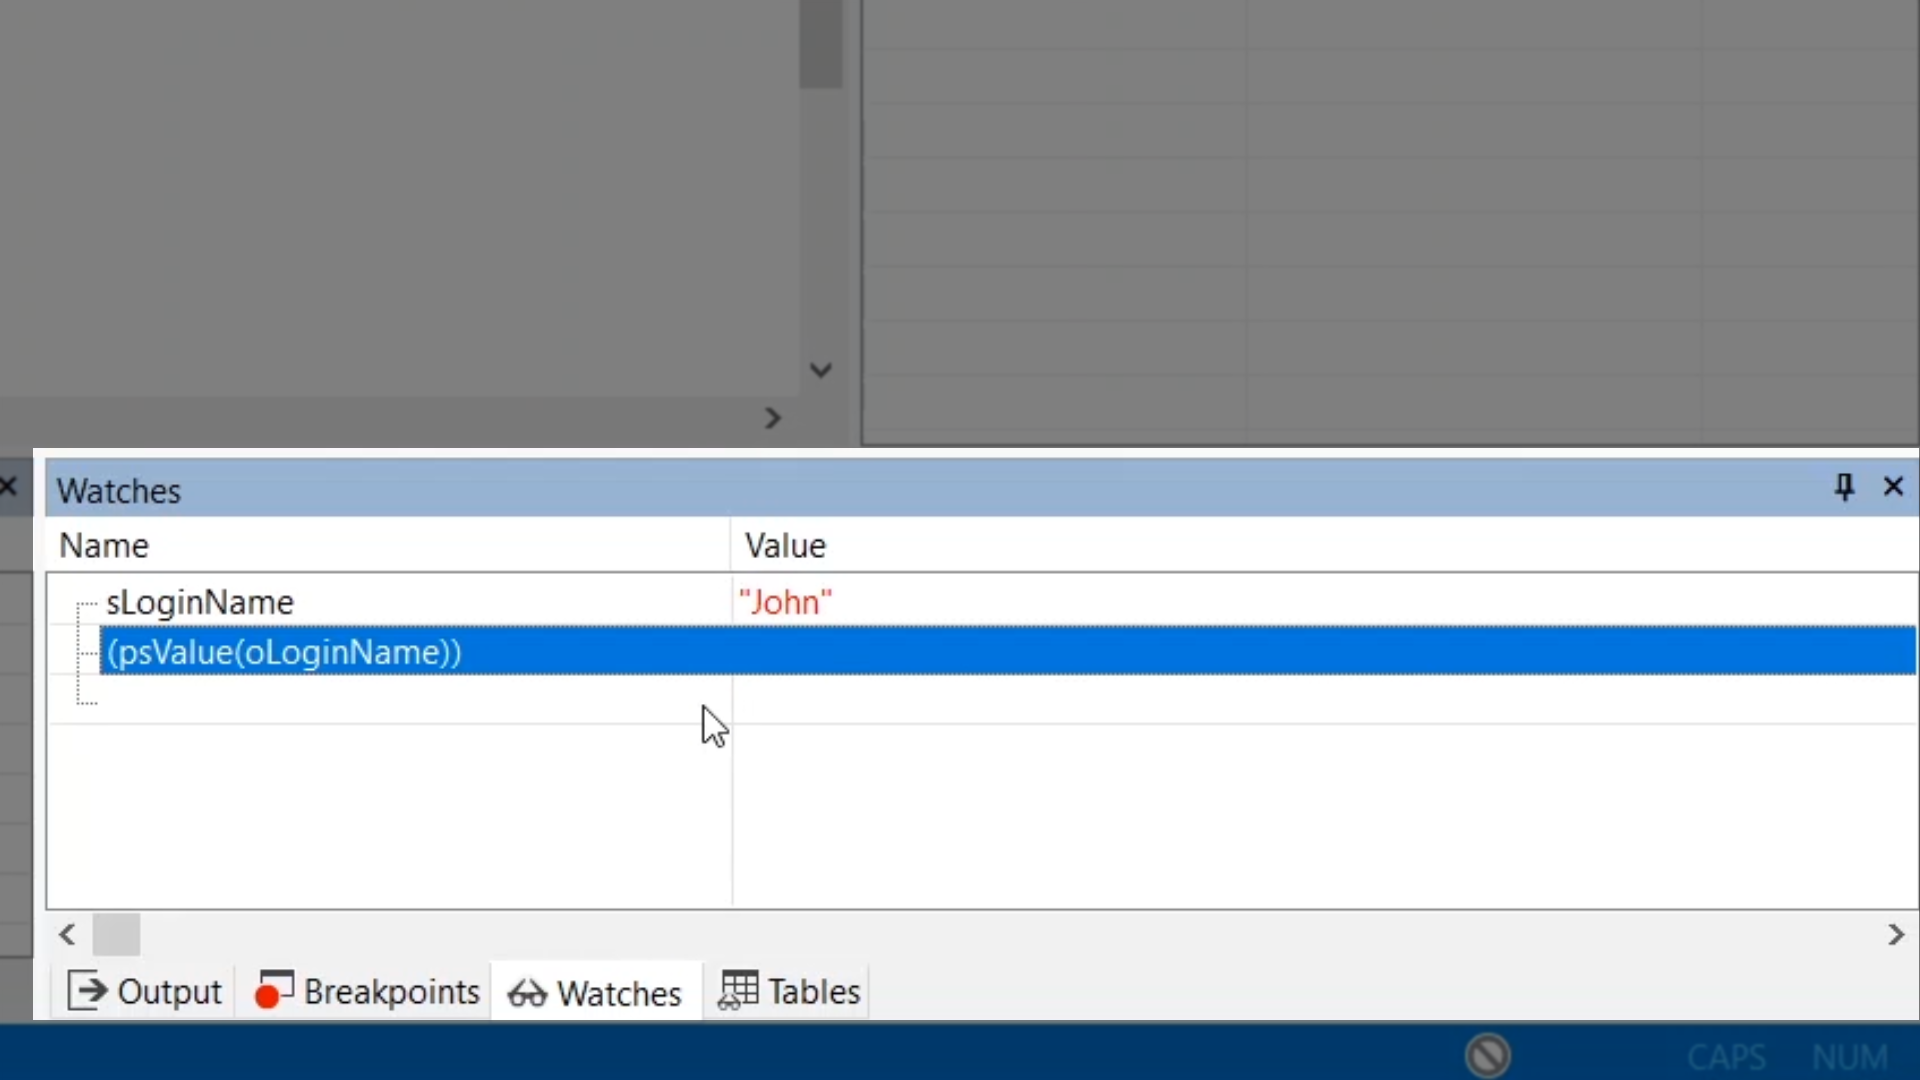
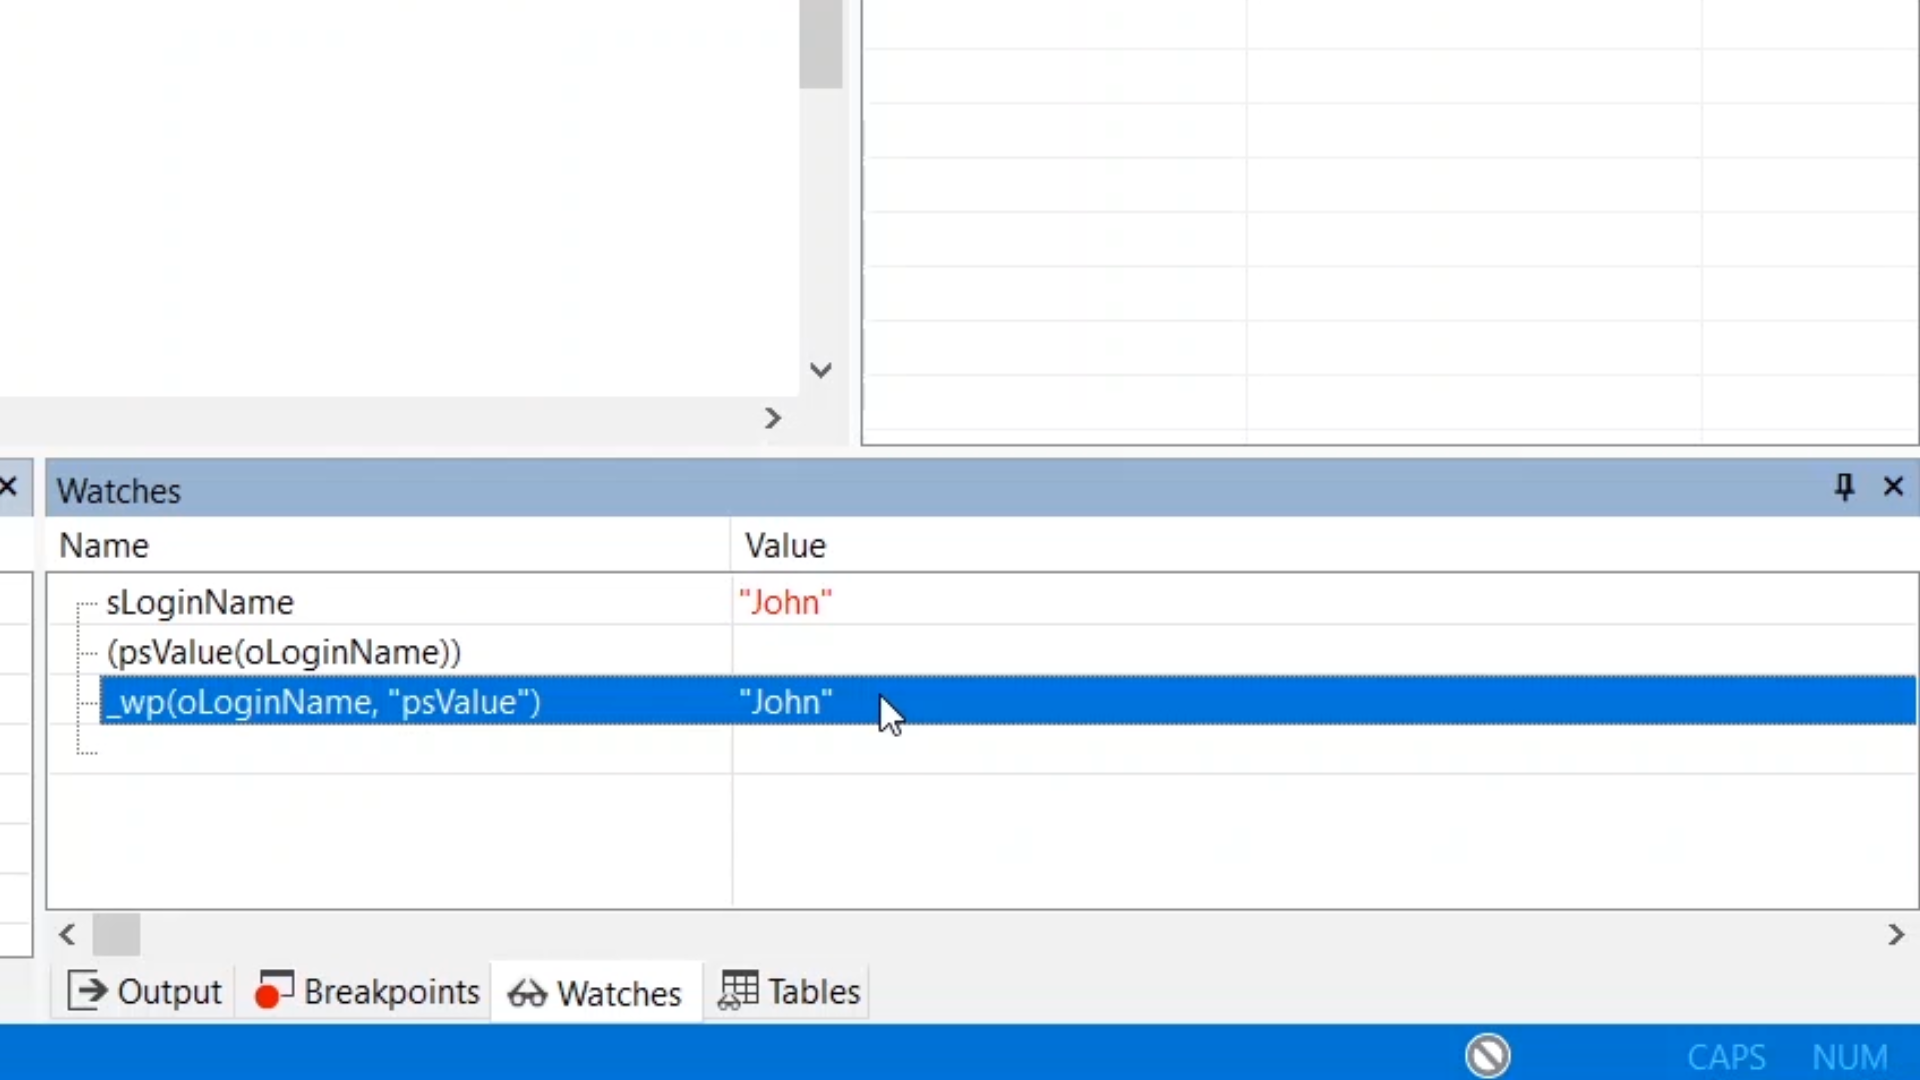
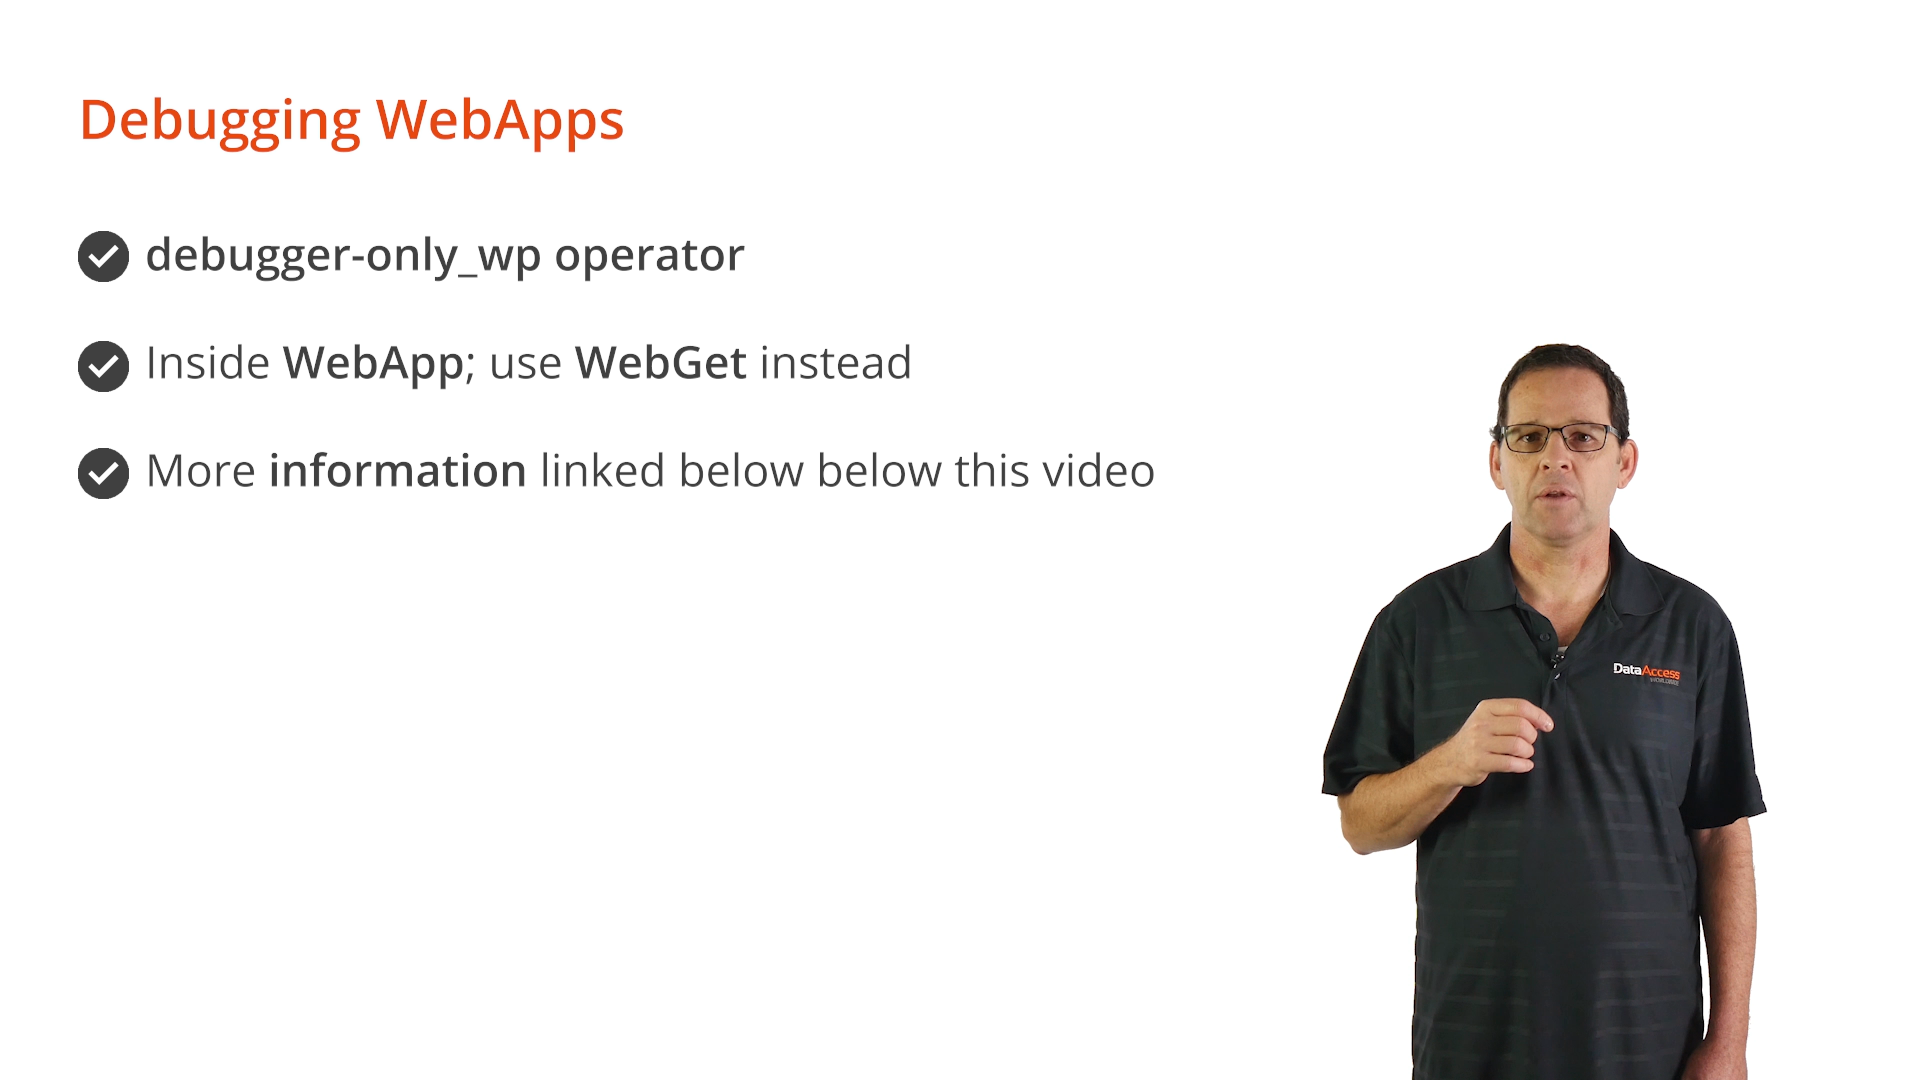
Web properties are complex properties that have both design time and web session values. Web session values of web properties can be evaluated in the Debugger using the Debugger-only “_wp” operator. Inside running WebApp code, “WebGet” can be used instead. 

Web properties are one of the most important concepts in DataFlex web applications. Learn more in the DataFlex Help.


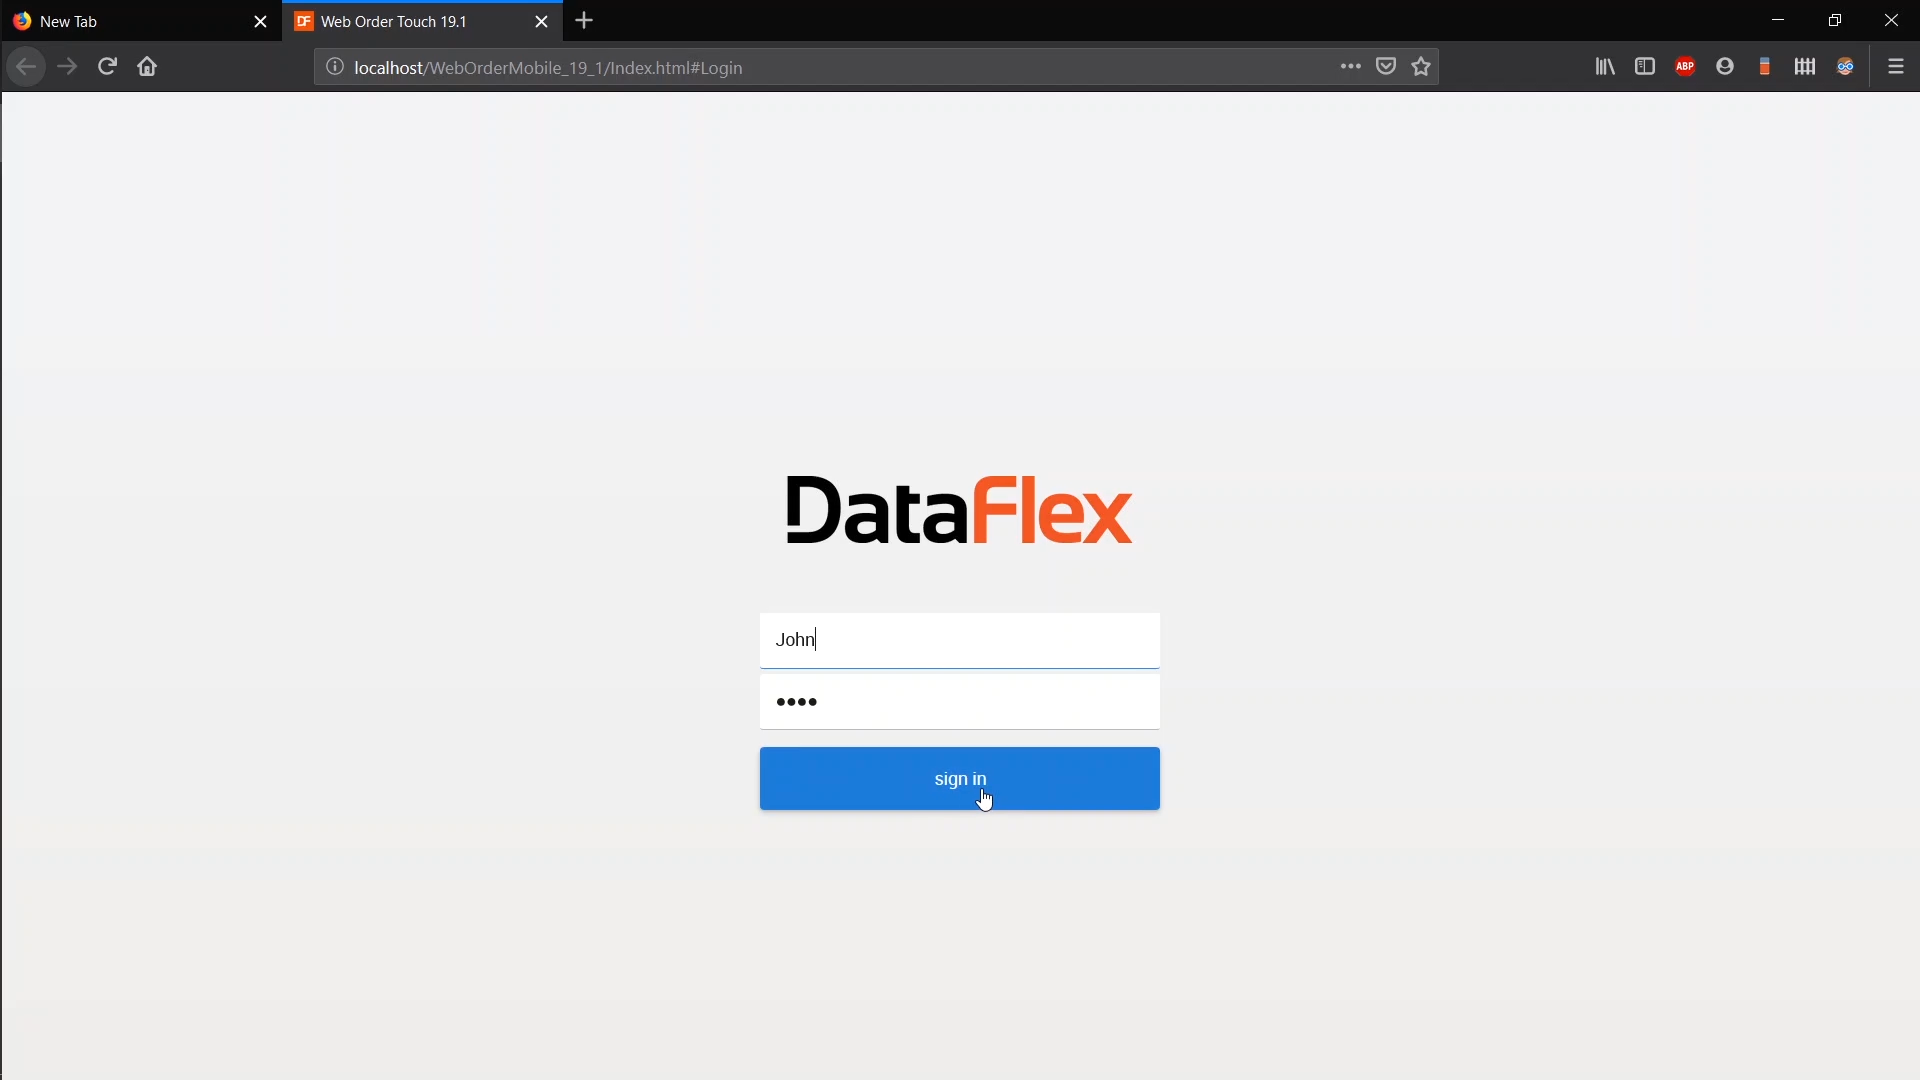
Only the server side of a WebApp can be debugged in the Debugger. The client side executes HTML and JavaScript in a browser window or tab. Use browser F12 tools to debug the client side. 

When running a web application in the debugger it is being run as an emulation of a full web service. A web application typically runs in a process pool where several processes are pre-loaded and take turns processing requests from the web client. Requests from the same WebApp session may connect to different processes. Debugging a WebApp runs as a single process, which means a process pooling environment cannot be completely emulated. Since the Debugger is part of the Studio, it runs under the same Window’s user account as the Studio. This may not be the same user account the DataFlex web application service runs under. As a result, access to databases and other files and locations that require permissions may not be the same as when the actual web application runs. 


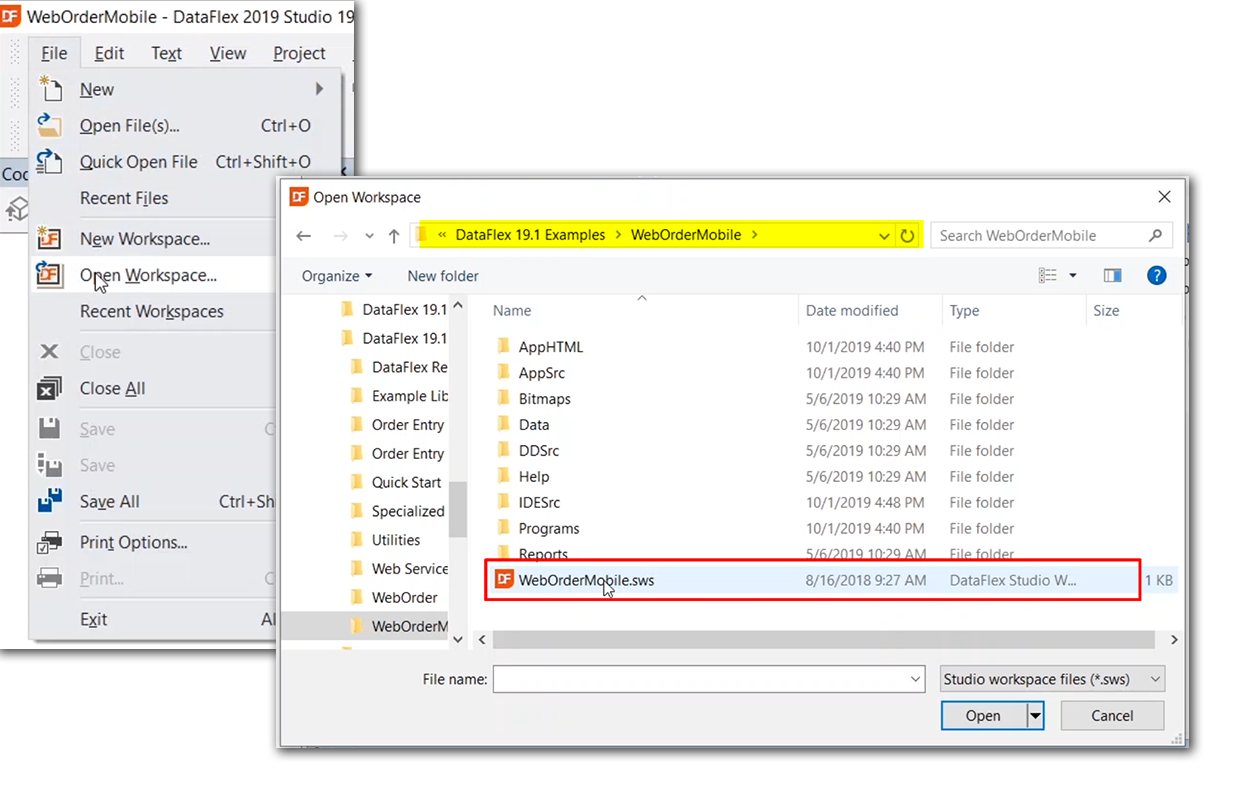
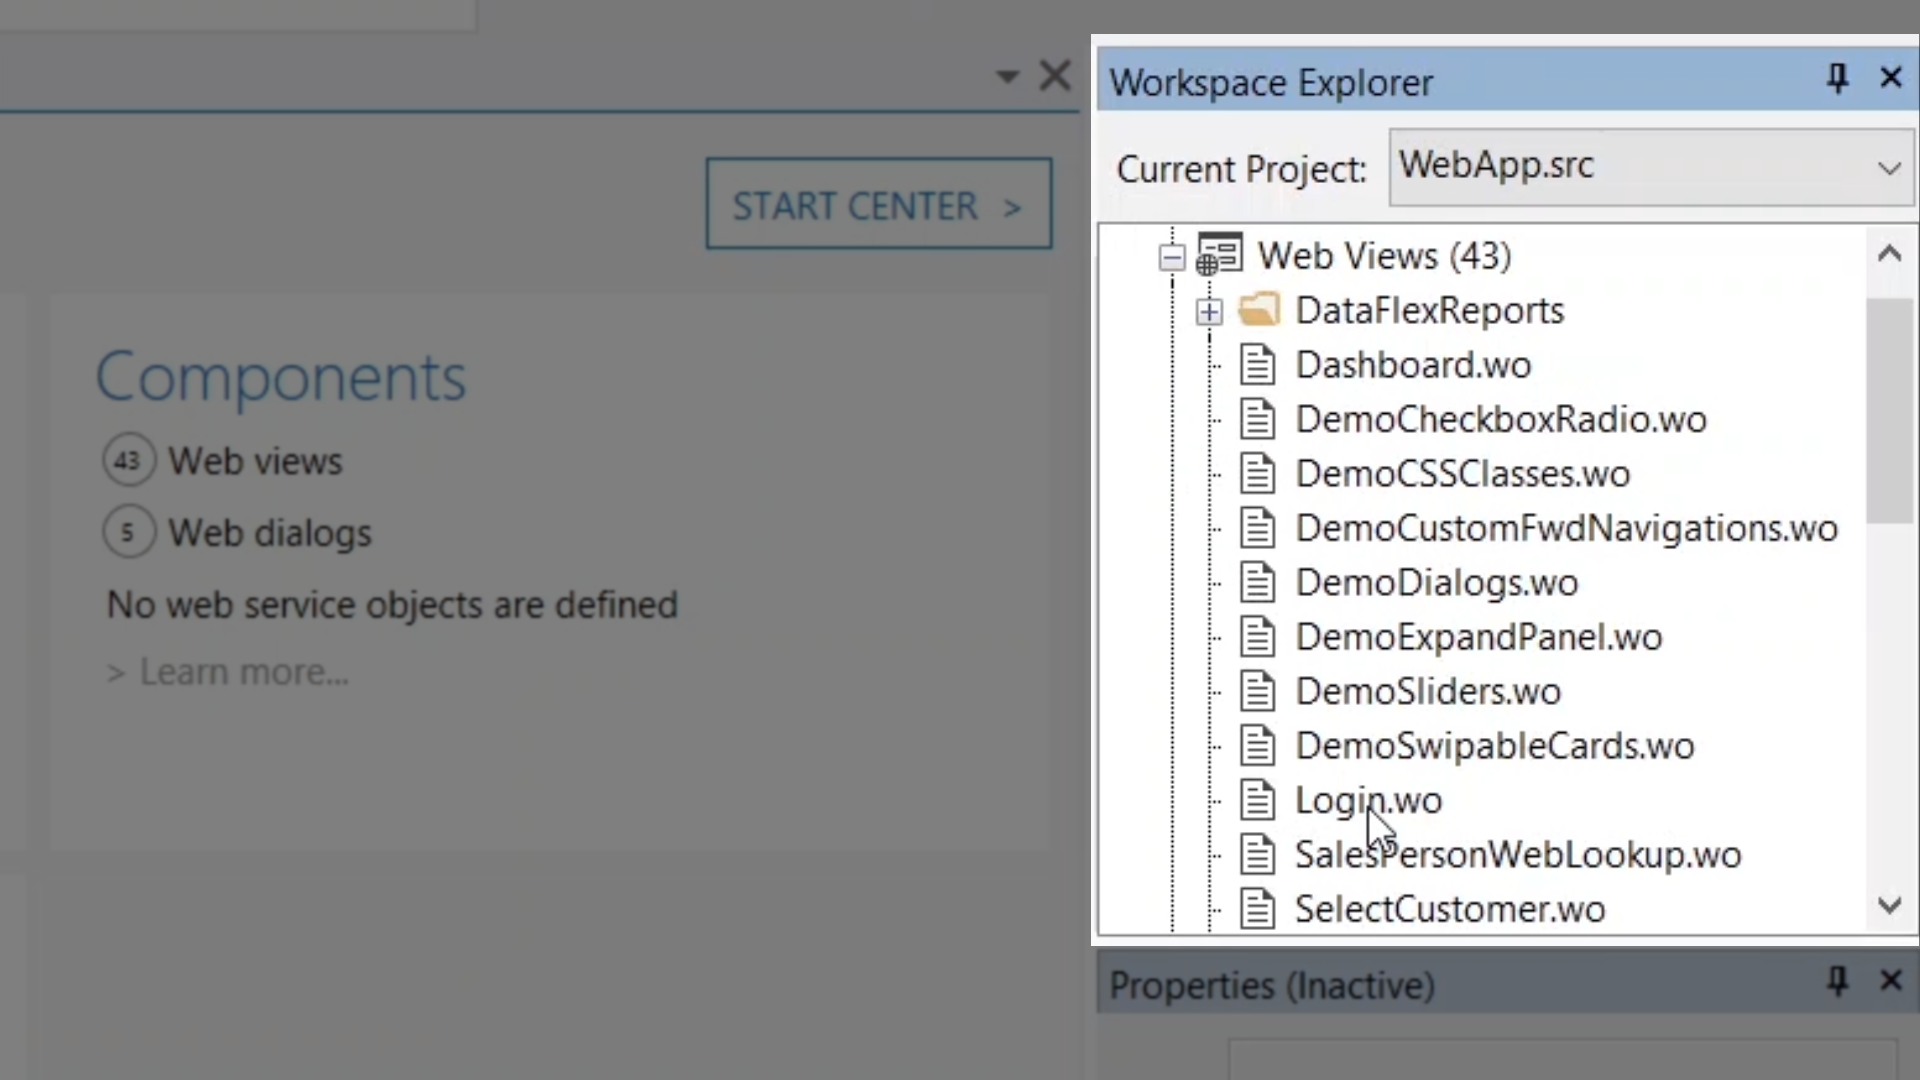
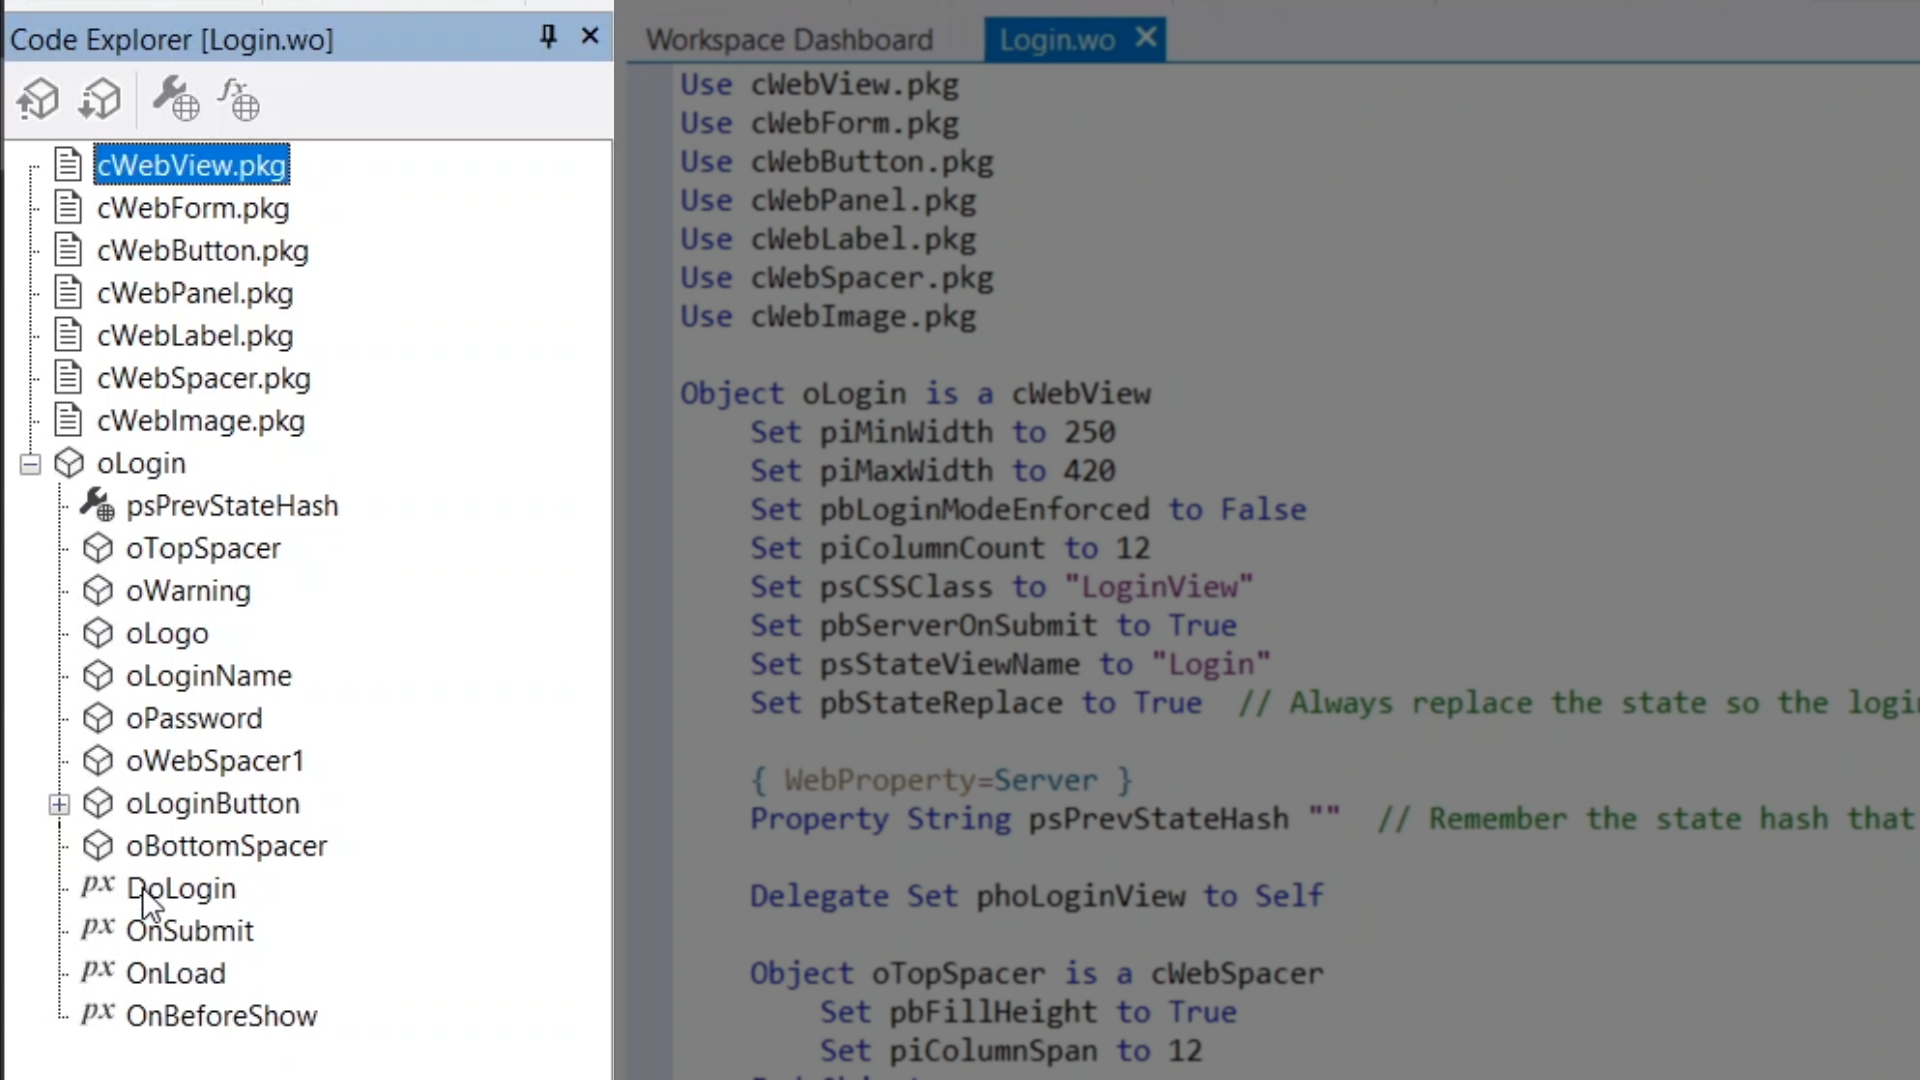
Demonstration – Debugging WebApps

  1. From the Studio, open the WebOrderMobile.sws sample workspace by going to FILE > OPEN WORKSPACE > WEBORDERMOBILE > WebOrderMobile.sws
  2. From the Workspace Explorer on the right, expand ‘WebApp.src’ and  then ‘Web Views’ to open ‘Login.wo’
  3. From the Code Explorer on left, expand ‘oLogin’ and click on ‘DoLogin’ to open it in the Code Editor
  4. Add a breakpoint to the line WebGet psValue of oPassword to sPassword
  5. Running the program will enter it in a browser window
  6. As with all sample applications, enter “John” as both the username and password
  7. Click on “sign in” to trigger the breakpoint in the Debugger
  8. Variables and web properties can be evaluated in the Debugger 
  9. If the psValue property of the ‘oLoginName’ object is evaluated as if it were a regular property the value will be shown as blank
  10. Using a regular property evaluation of a web property will return the value of the property that was assigned at design time
  11. A special Debugger-only operator called ‘_wp’ allows the evaluation of web properties, and returns the value of web property in the current web session
  12. Note: Place the property name in quotes when using _wp