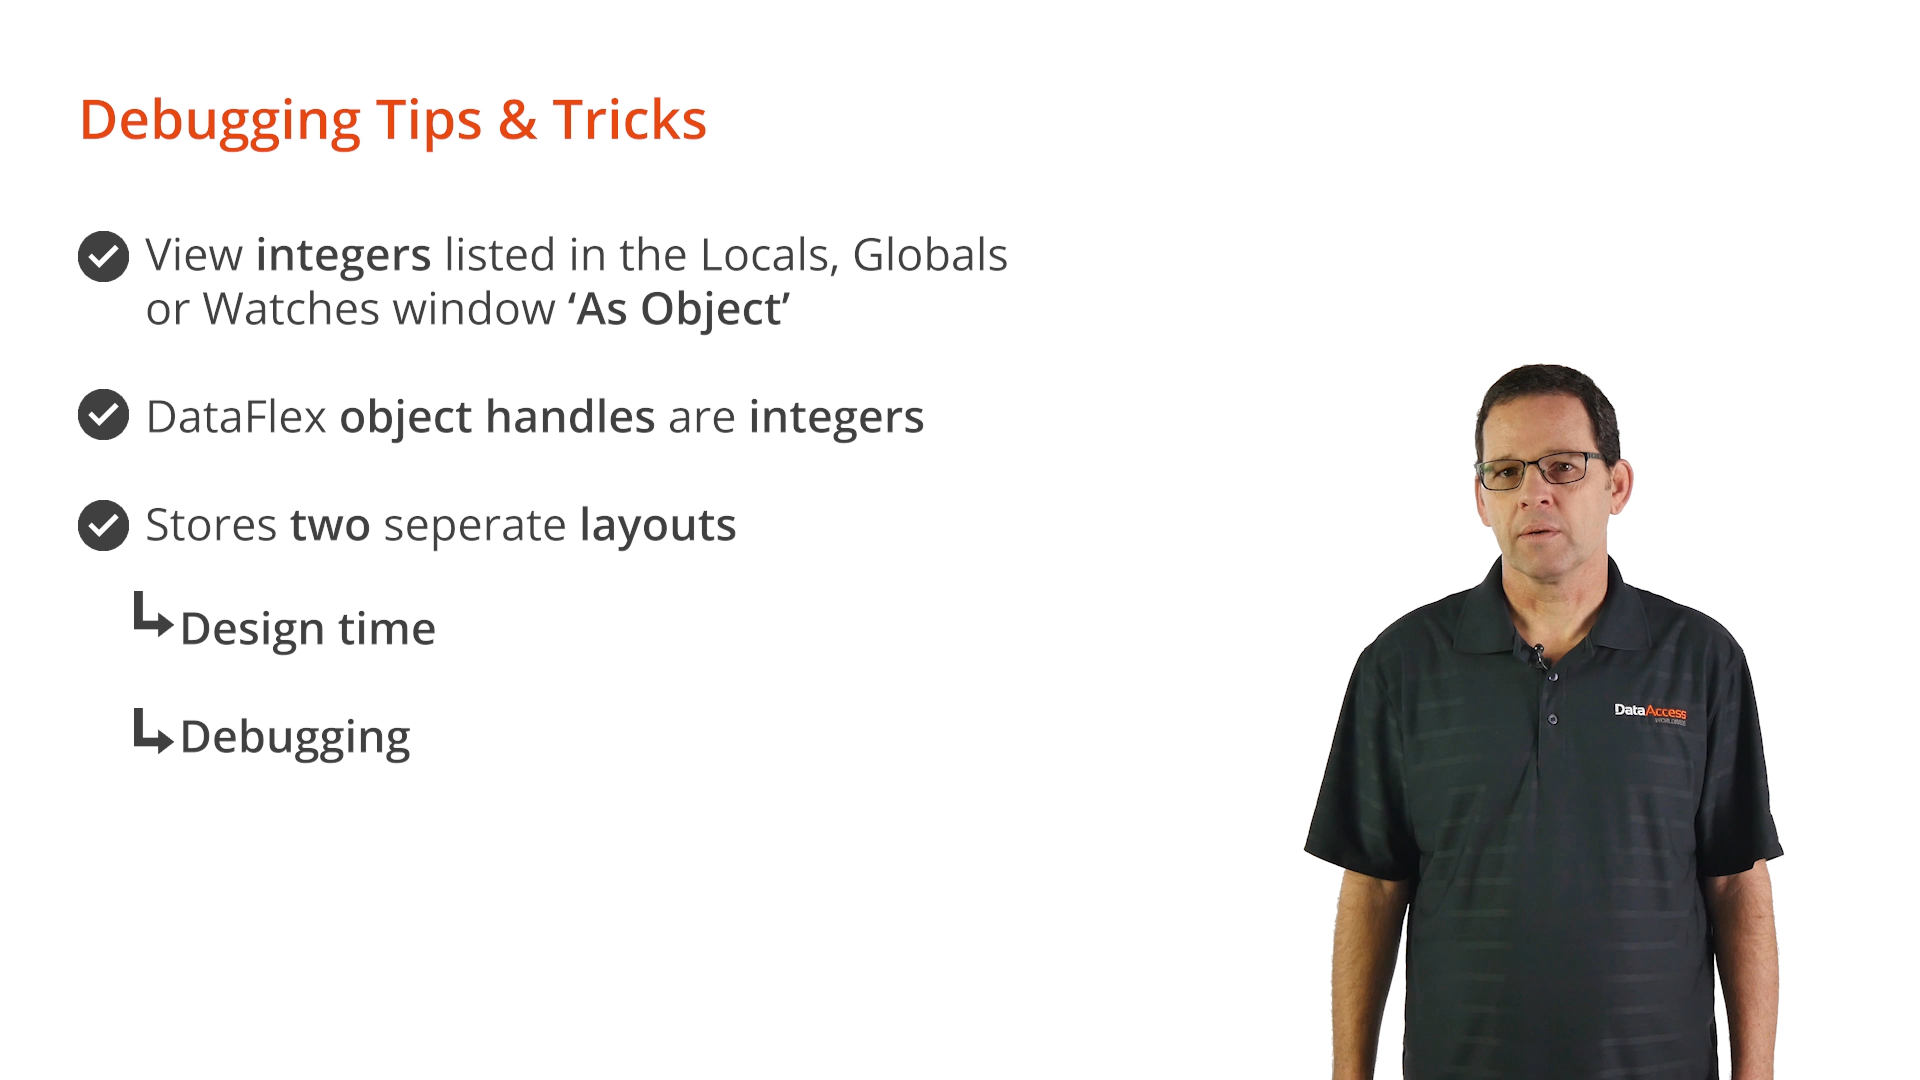
Any integer value can be viewed in the Locals, Globals or Watches windows as “As Object.” This takes advantage of DataFlex object handles being integers. This allows parent and child objects of that object to be viewed. The Studio stores two separate layouts; design time and debugging. Each layout is retained as the developer has arranged it. The default version of either layout can be returned to from the TOOLS menu.
Attaching to an already running process is useful if an error occurs in a program that was not started in the Debugger. To do this, choose ‘Attach to Process’ from the debug menu.
The Studio, by default, runs programs in debug mode. To run a Windows program outside of debug mode, launch it from outside the Studio. To run a WebApp outside of debug mode, right click in Workspace Explorer and select ‘Open Application URL’ from the context menu.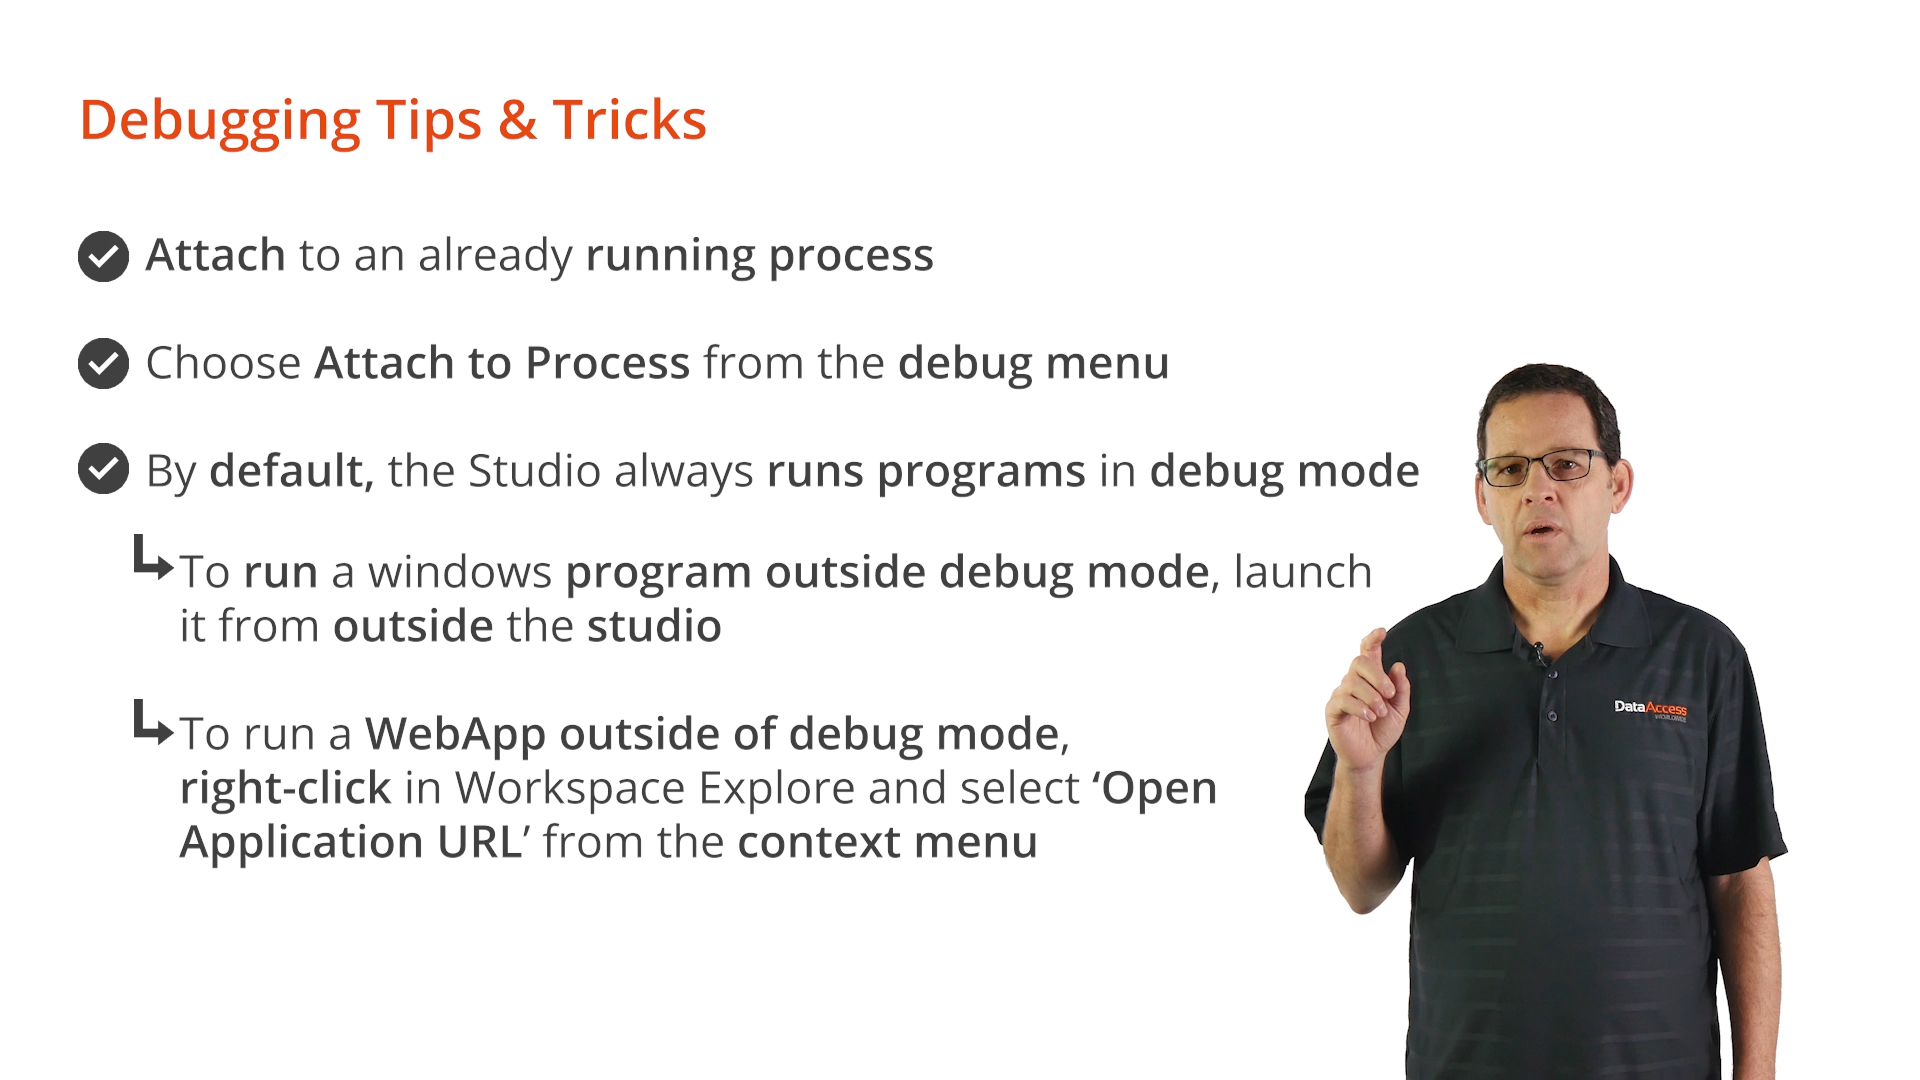
While debugging, unhandled errors have a Debug button in the error dialog that allows the location of the line that triggered the error to be quickly found. The location of an instruction address can also be found by selecting ‘Go To Instruction Address’ from the Debug menu. Instruction Addresses are created when a program is compiled, and the source code lines and files are combined. They can be found in an error dialog or a .PRN file, which is created when compiling.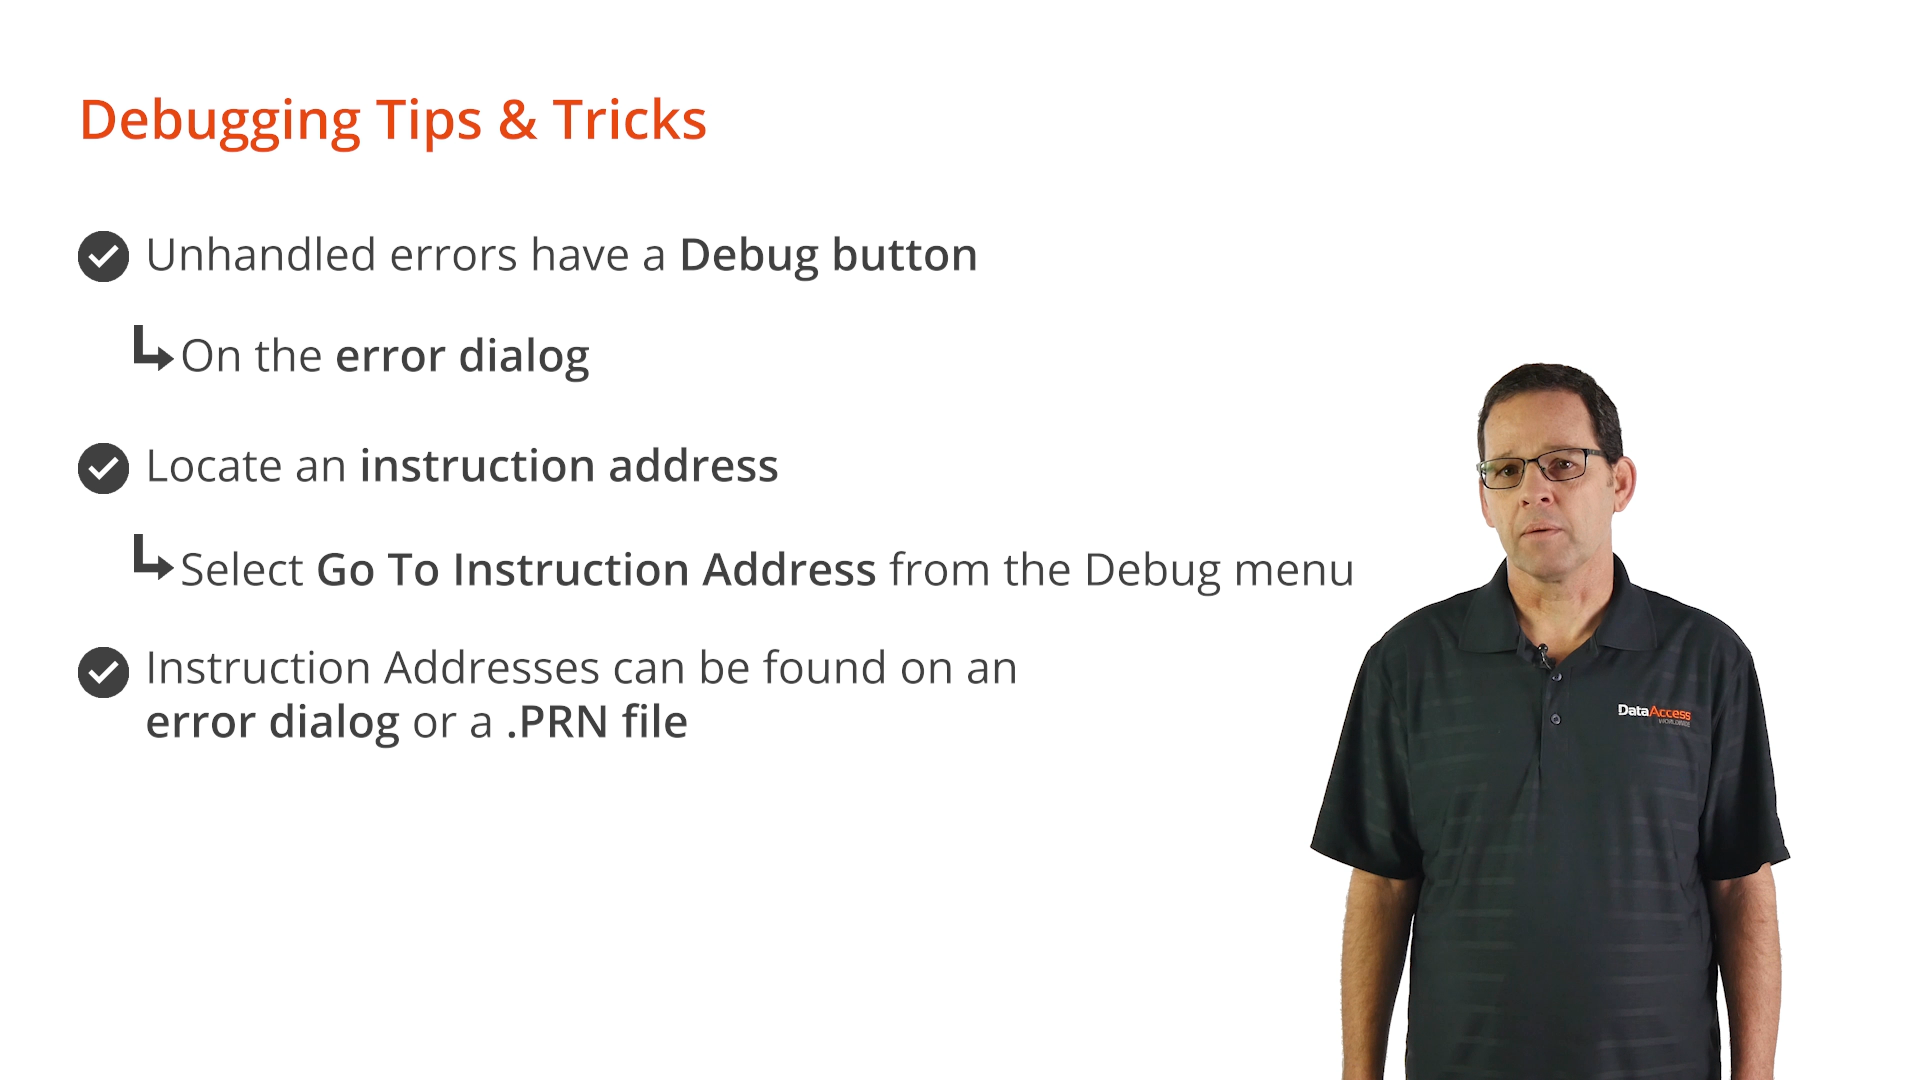
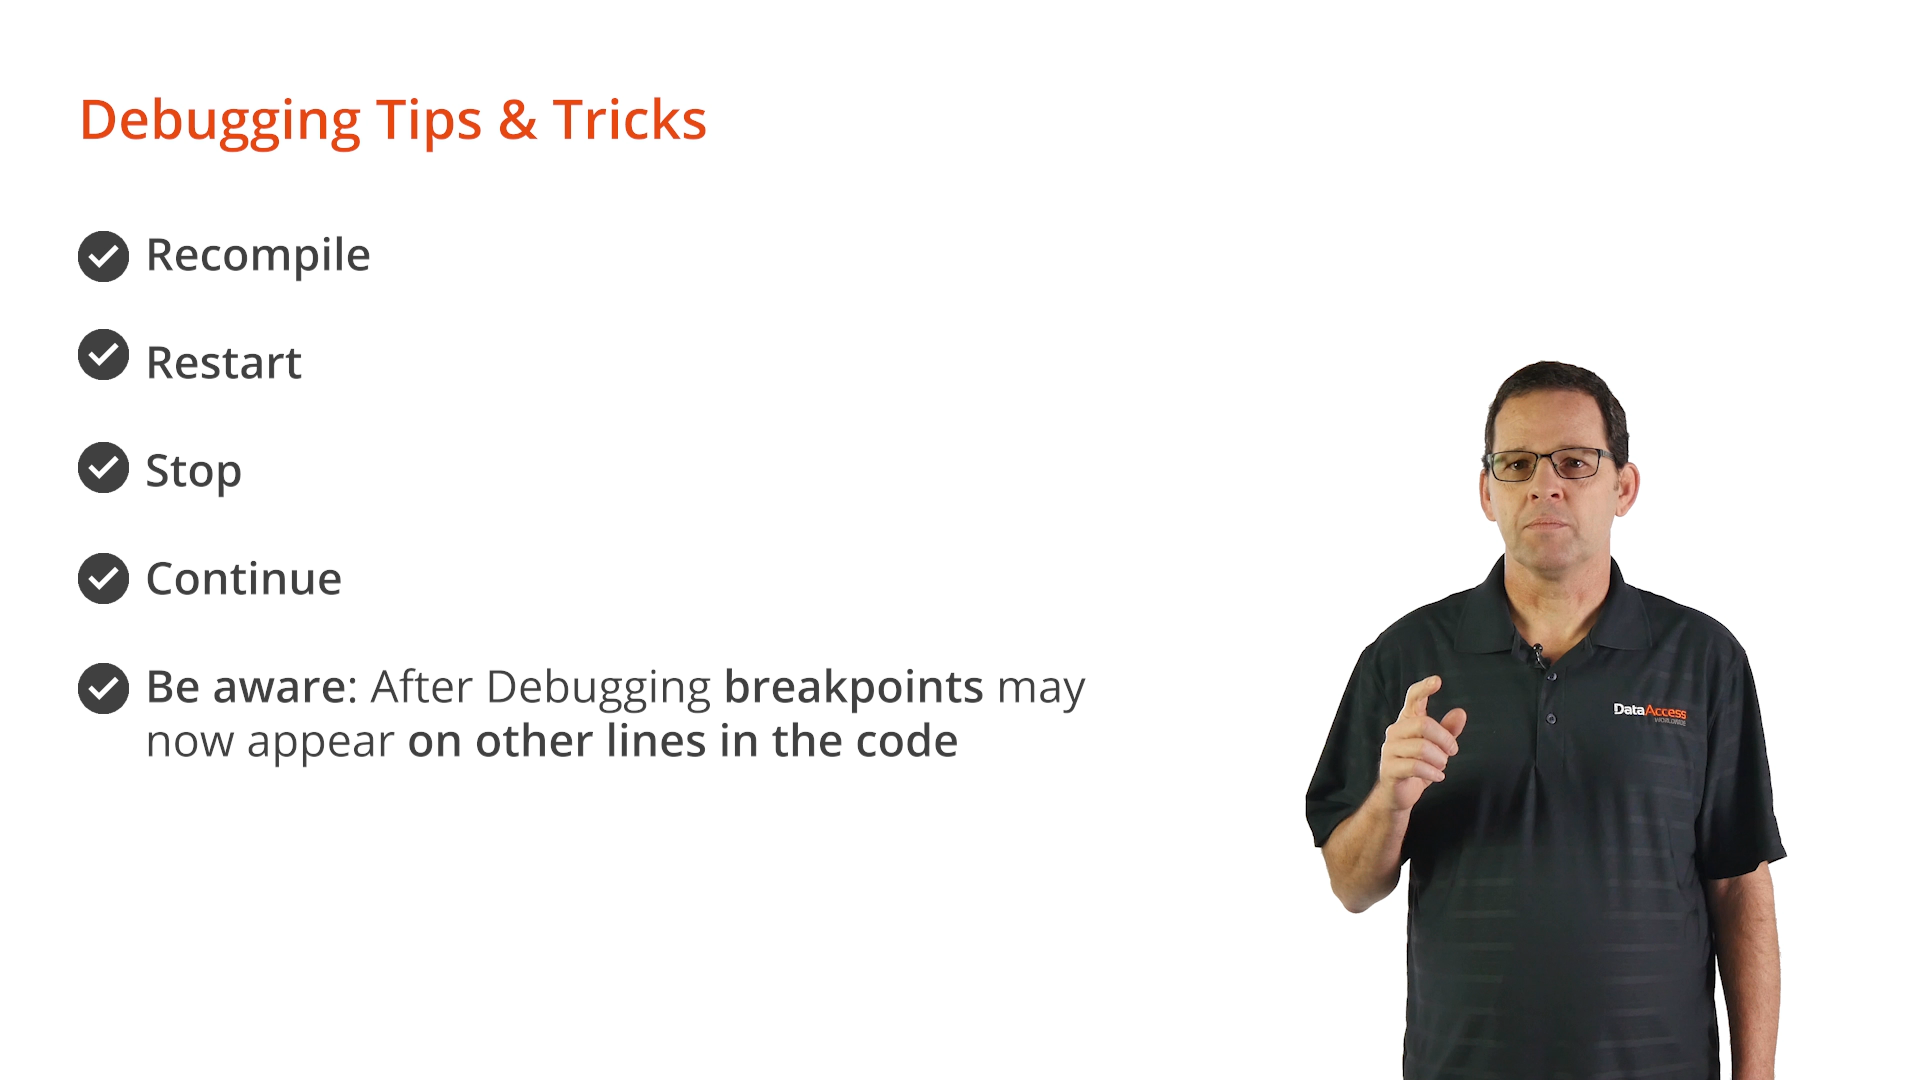
If source code is changed during debugging, the debugger will ask to recompile, restart, stop or continue on the next execution step that is to be performed.
Note: depending on the code changes, breakpoints may have moved, or other unexpected behaviors may occur.