REFERENCE LIBRARY
LEARNING CENTER
DataFlex Reports Quickstart
To continue with this content, please log in with your
Data Access ID
or create a new account.
Cancel
Data Access ID
You may not be authorized to see this content. Please contact
Data Access Europe
for more information.
Cancel
Data Access Europe
You are not authorized to see this content.
Cancel
Data Access Europe
DataFlex courses
The Basics
Whats New in DataFlex 2024
Getting to know the Web Controls
Whats New in DataFlex 2023
Whats New in DataFlex 2022
Getting the most out of the WebList
Migrating to DataFlex 2021
Try for free: DataFlex Personal
Debugging DataFlex Apps
Learn the language
Security the Basics
DataFlex in 5 minutes
Studio Tour
DataFlex Extensions
Using the troubleshooting tool DataFlex Diagnostics
DataFlex QR and Barcode Scanner
DataFlex Library for LibXL
Quill Editor Library
PdfViewer
Custom Control: WebImageZoom
Printer Driver Analyzer
Dynamic Objects Library
Web Scheduler Library
Custodian 19.1
Deployment
DataFlex and Continuous Integration
How to deploy your WebApp
Configuring your system for DataFlex Web Development
Web
The CSS and HTML Secrets of DataFlex WebApps
Quickstart building a web application (Mobile touch)
Working with the WebContextMenu in DataFlex
The Drag and Drop Framework in DataFlex
How to work with the WebTagsForm
Build HTTP Services in DataFlex
5 Common WebApp Mistakes
History Management
Process Pooling
Advanced Dynamic Objects
Working with Web Properties
Working with Databases
Custom Controls
SOAP Web Services
Multi Tenancy
Quickstart building a web application (Desktop)
SQL
Using Managed Connections in DataFlex
Migrating to MySQL Environment
SQL Search
DataFlex Reports
Runtime Data Source (RDS)
Page Layers
DataFlex Reports Quickstart
SQL Statements
Charts
Label Reports
Maintenance Program
Other
Efficient version control with Git in DataFlex
Using WebView2 in DataFlex
Tips on using the build automation tool Jenkins within DataFlex
How to use the DataFlex Styler
How to setup a livestream event
UX UI tips for application controls
Secure your web applications with HTTPS
UX UI Design principles for application development
Working with JSON
Build your own Search Engine
Information
Events
DataFlex Feature Demo FlexTron DANA
DataFlex 2023 Feature Demo DANA
EDUC 2022
Data Access Anniversary Event
EDUC 2020
EDUC 2018
Synergy 2019
DataFlex Reports Quickstart
Introduction
(0m 54s)
DataFlex database
(2m 29s)
ODBC
(2m 56s)
Runtime Data Source
(2m 06s)
Enhance the report
(2m 15s)
Next lesson:
Cancel
DataFlex Reports Quickstart
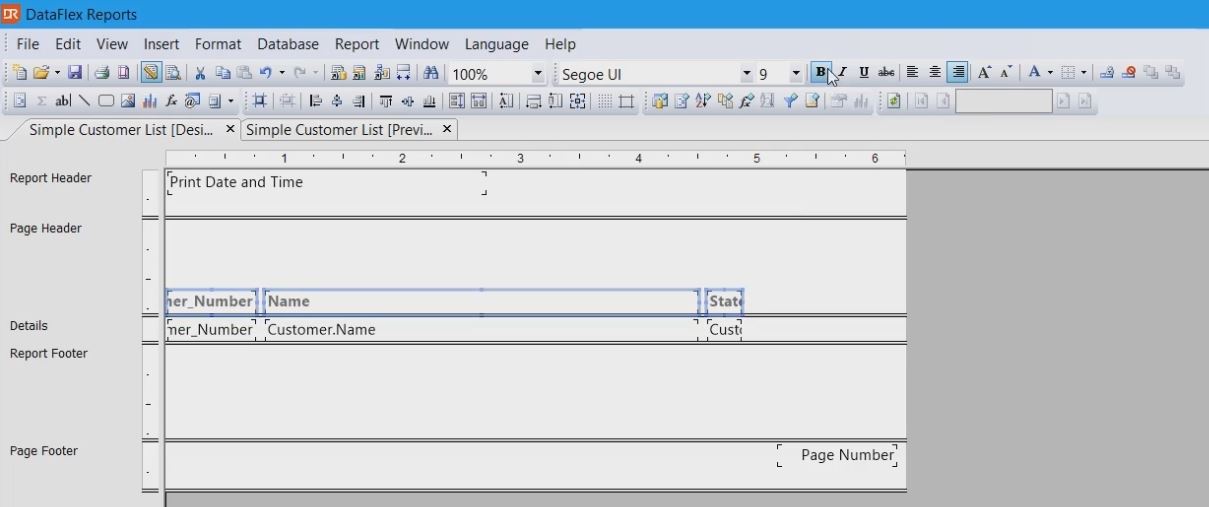
Lesson 4: Runtime Data Source
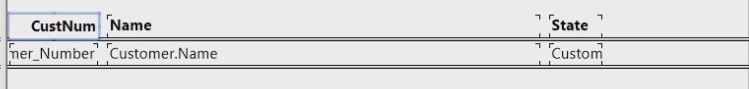
Select all the header sections and make them bold.
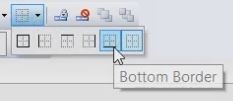
And add a bottom border.
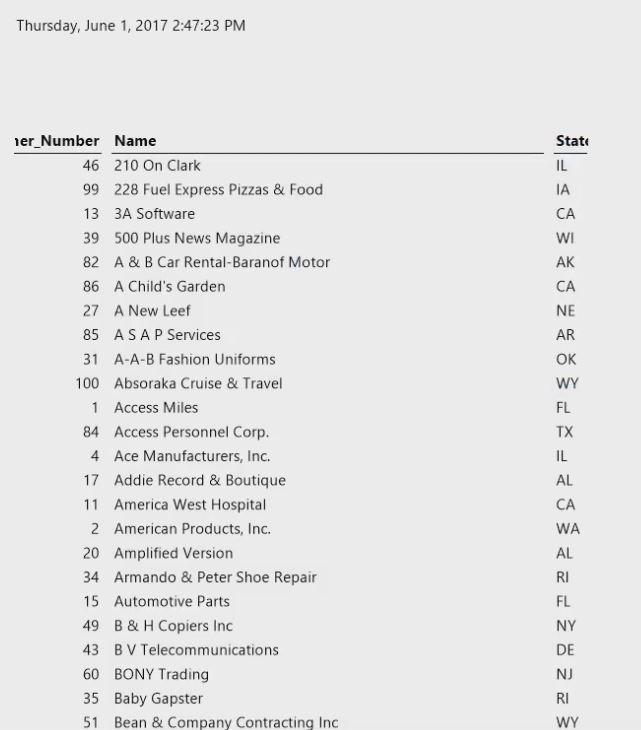
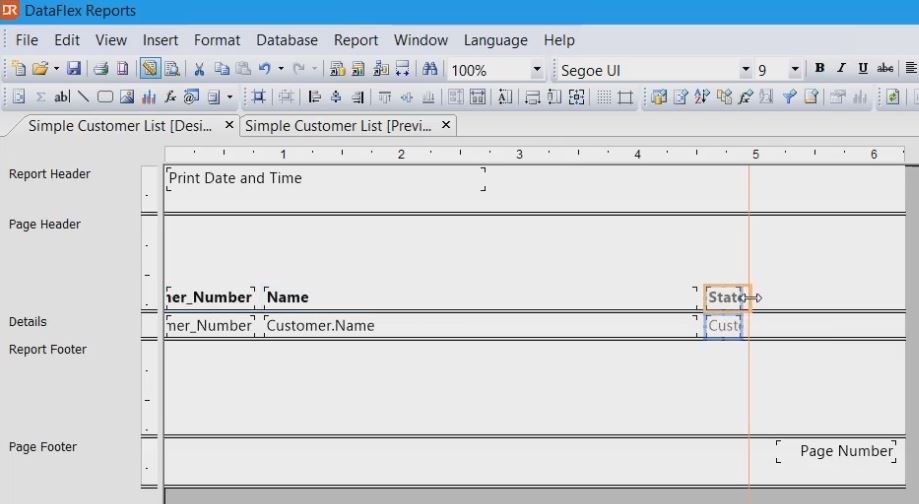
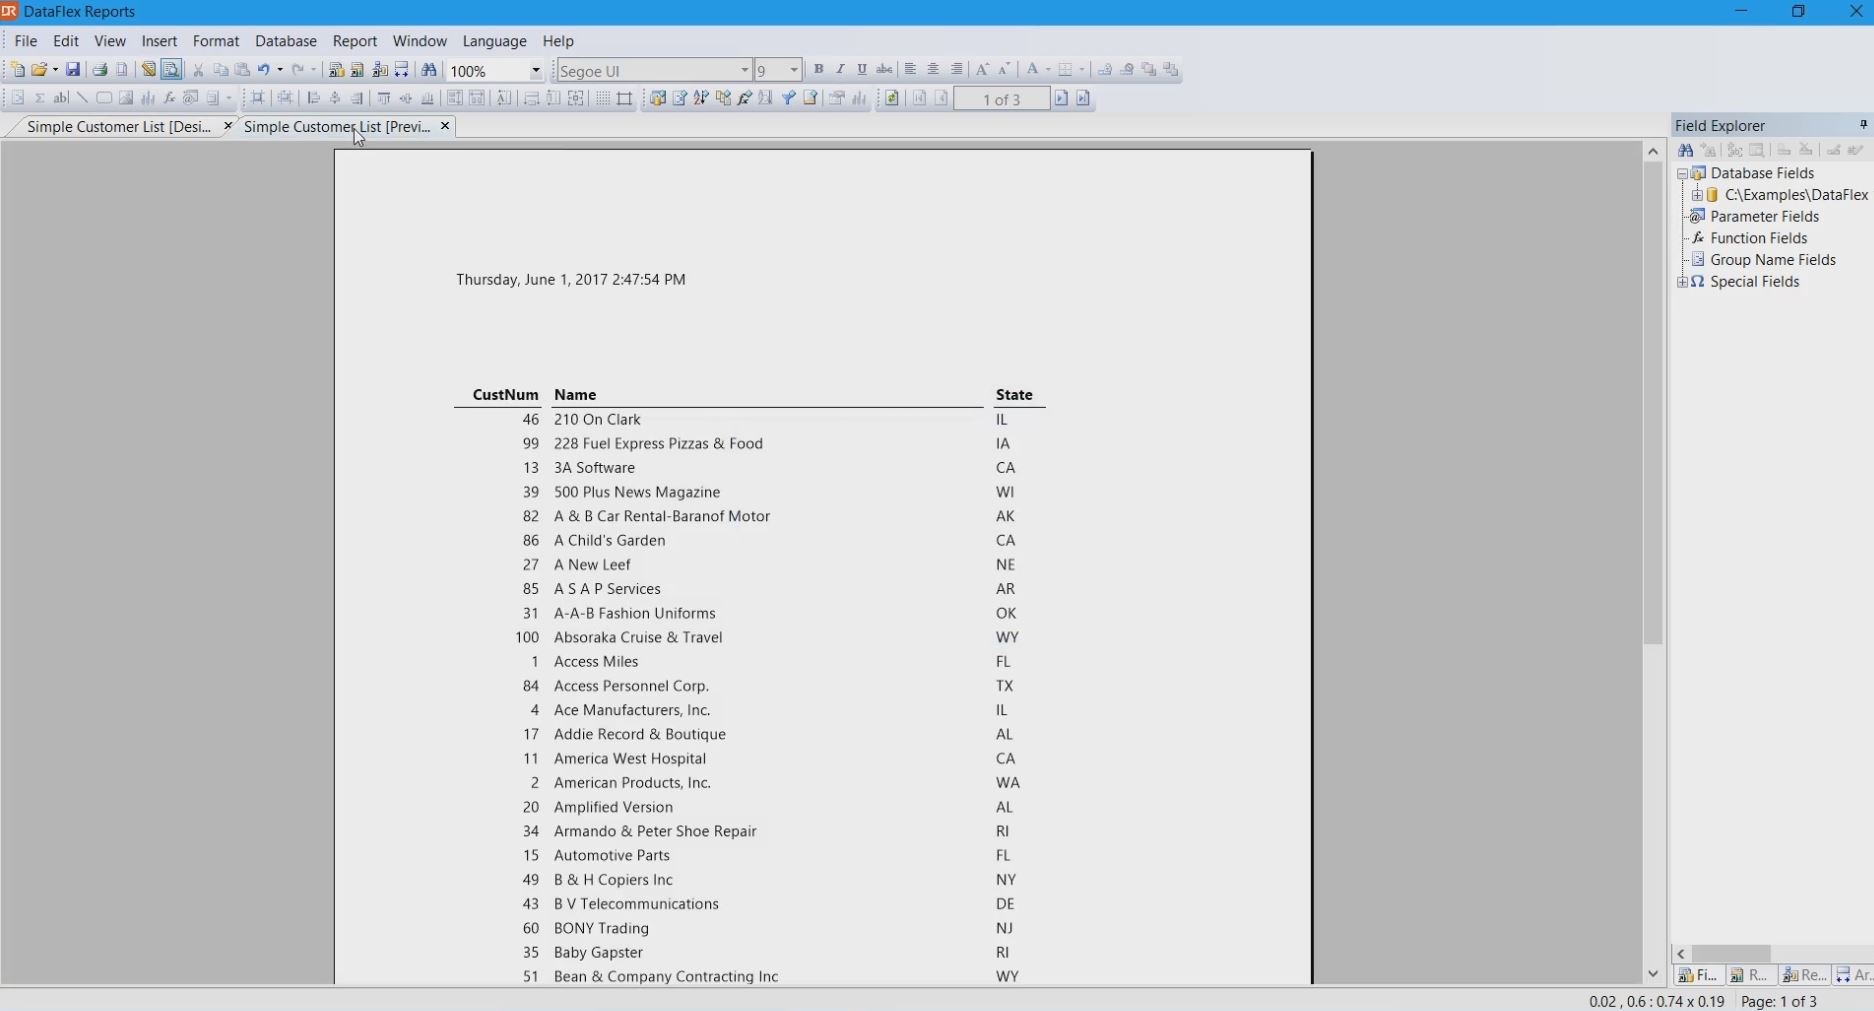
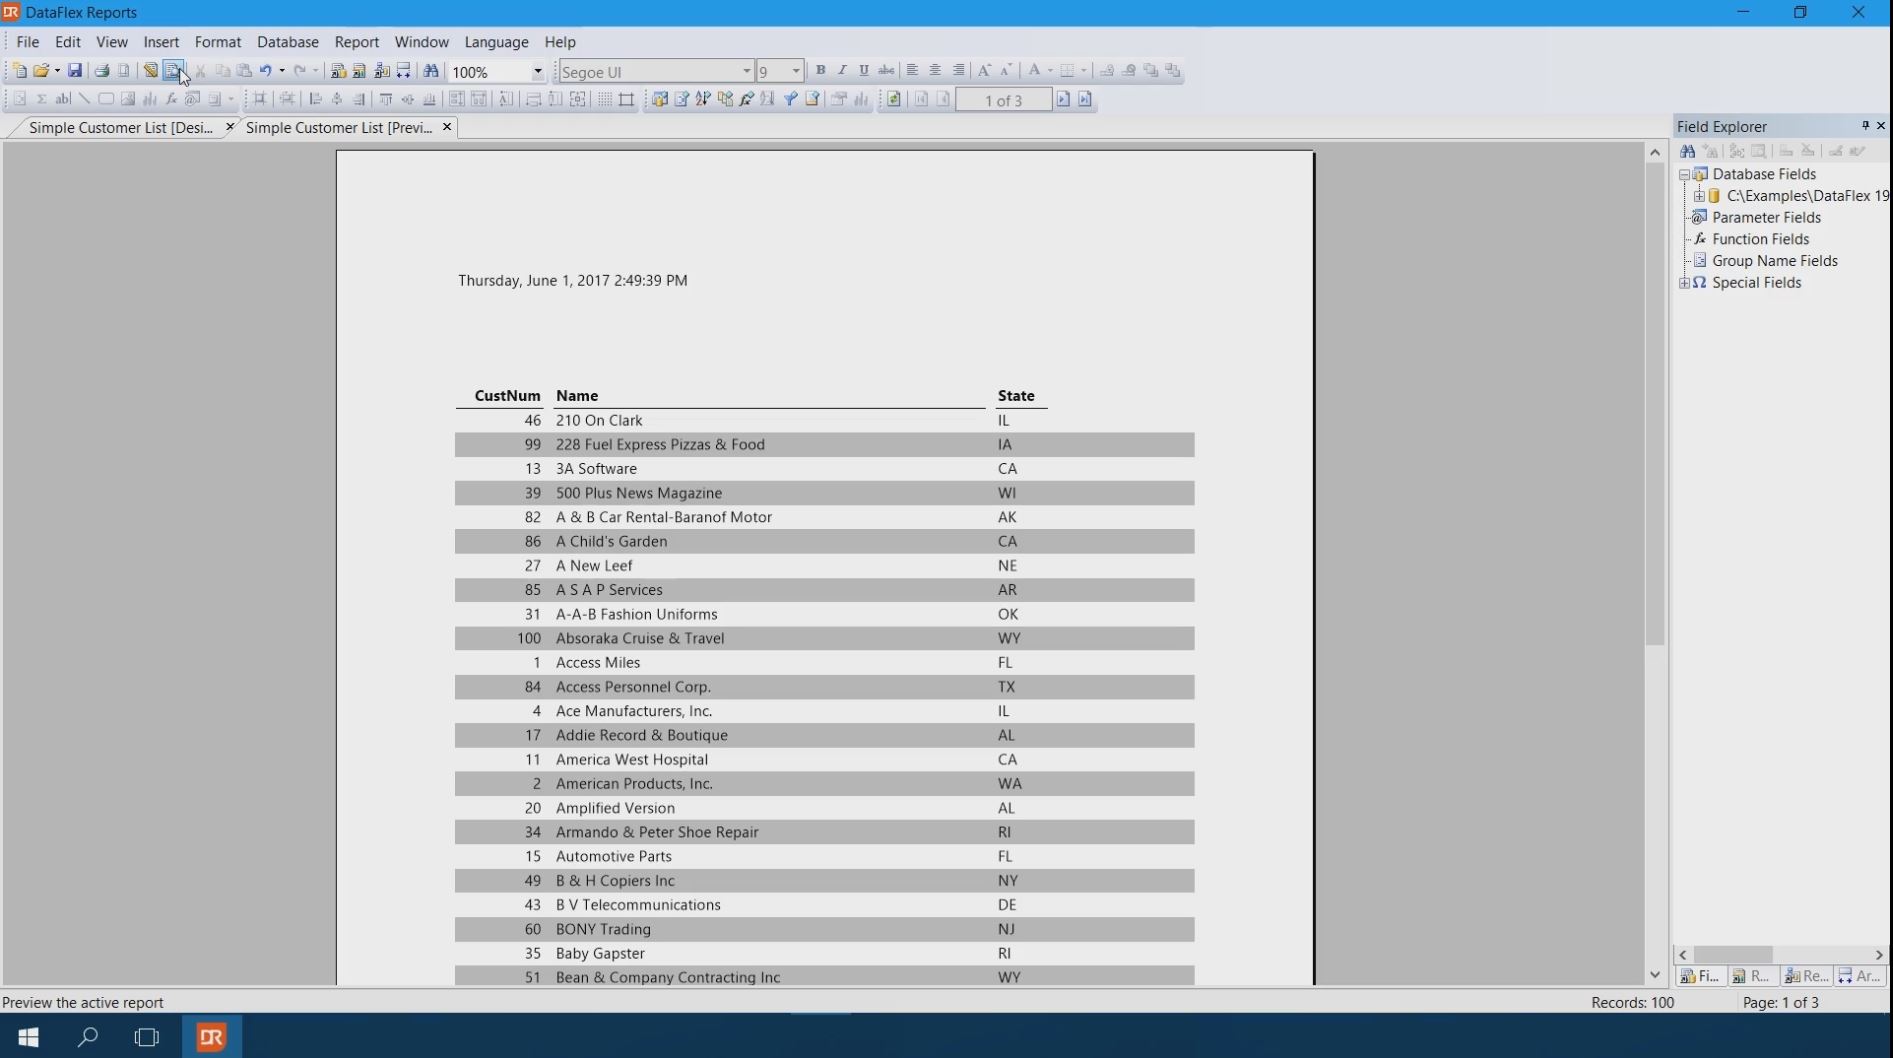
Go to the Preview, the 'State' column is too small.
Select the State column and drag it to give it more space.
The values in the 'Customer_Number' column will be small, so make the nam smaller. In this example 'CustNum'.
Take a look at the preview to see the changes.
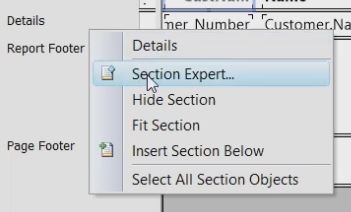
Let's add a 'Zebra color'. Every even and oneven row get's a different background color.
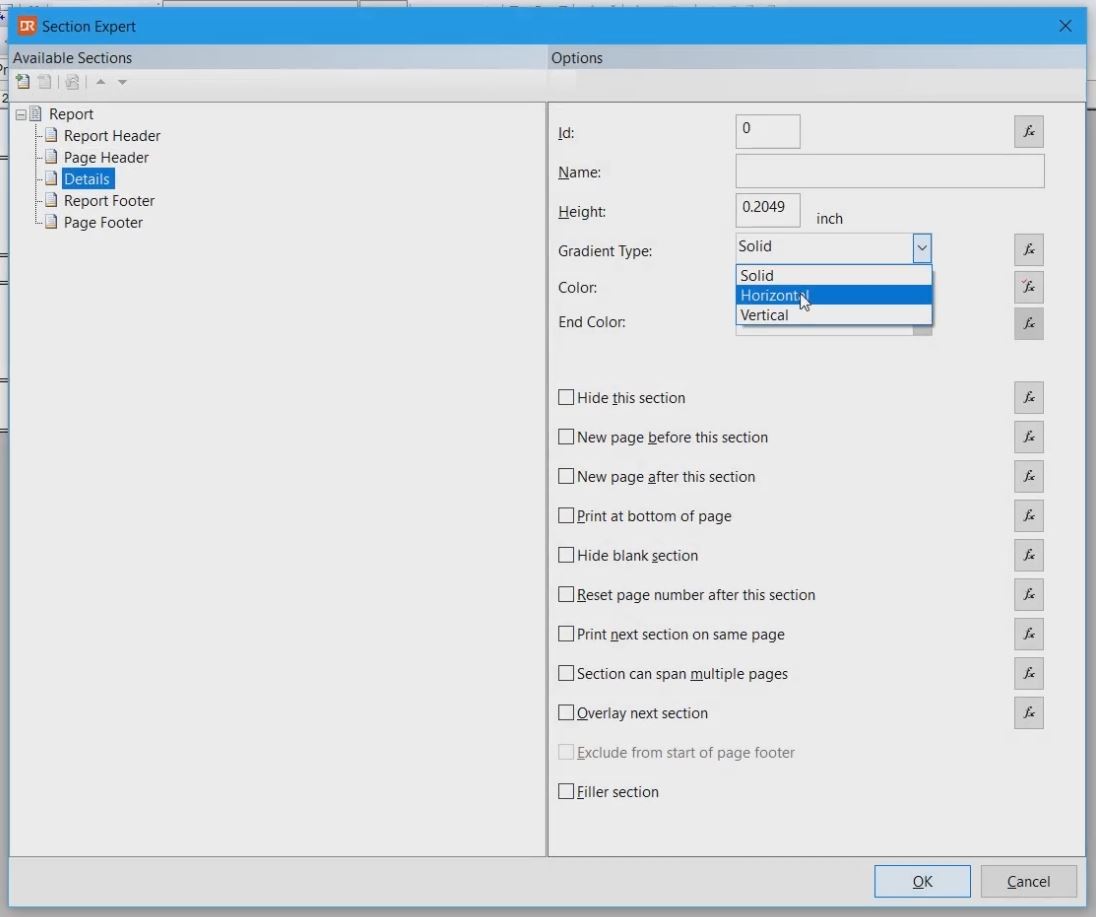
Move the mouse to the left margin of theReport Designer, click the right mouse and open the section expert.
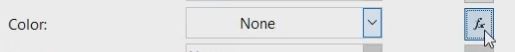
Change the 'Gradient Type' to 'Solid'.
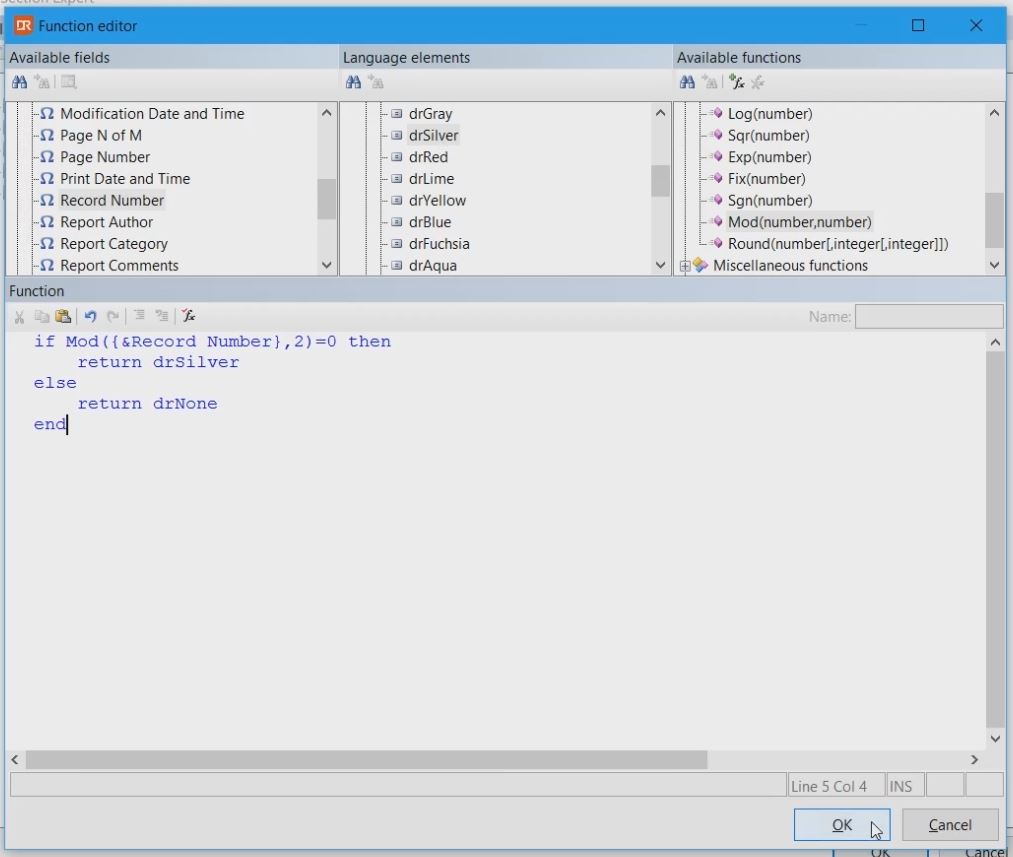
Choose the formula button next to color.
Enter the following code to create a zebra color:
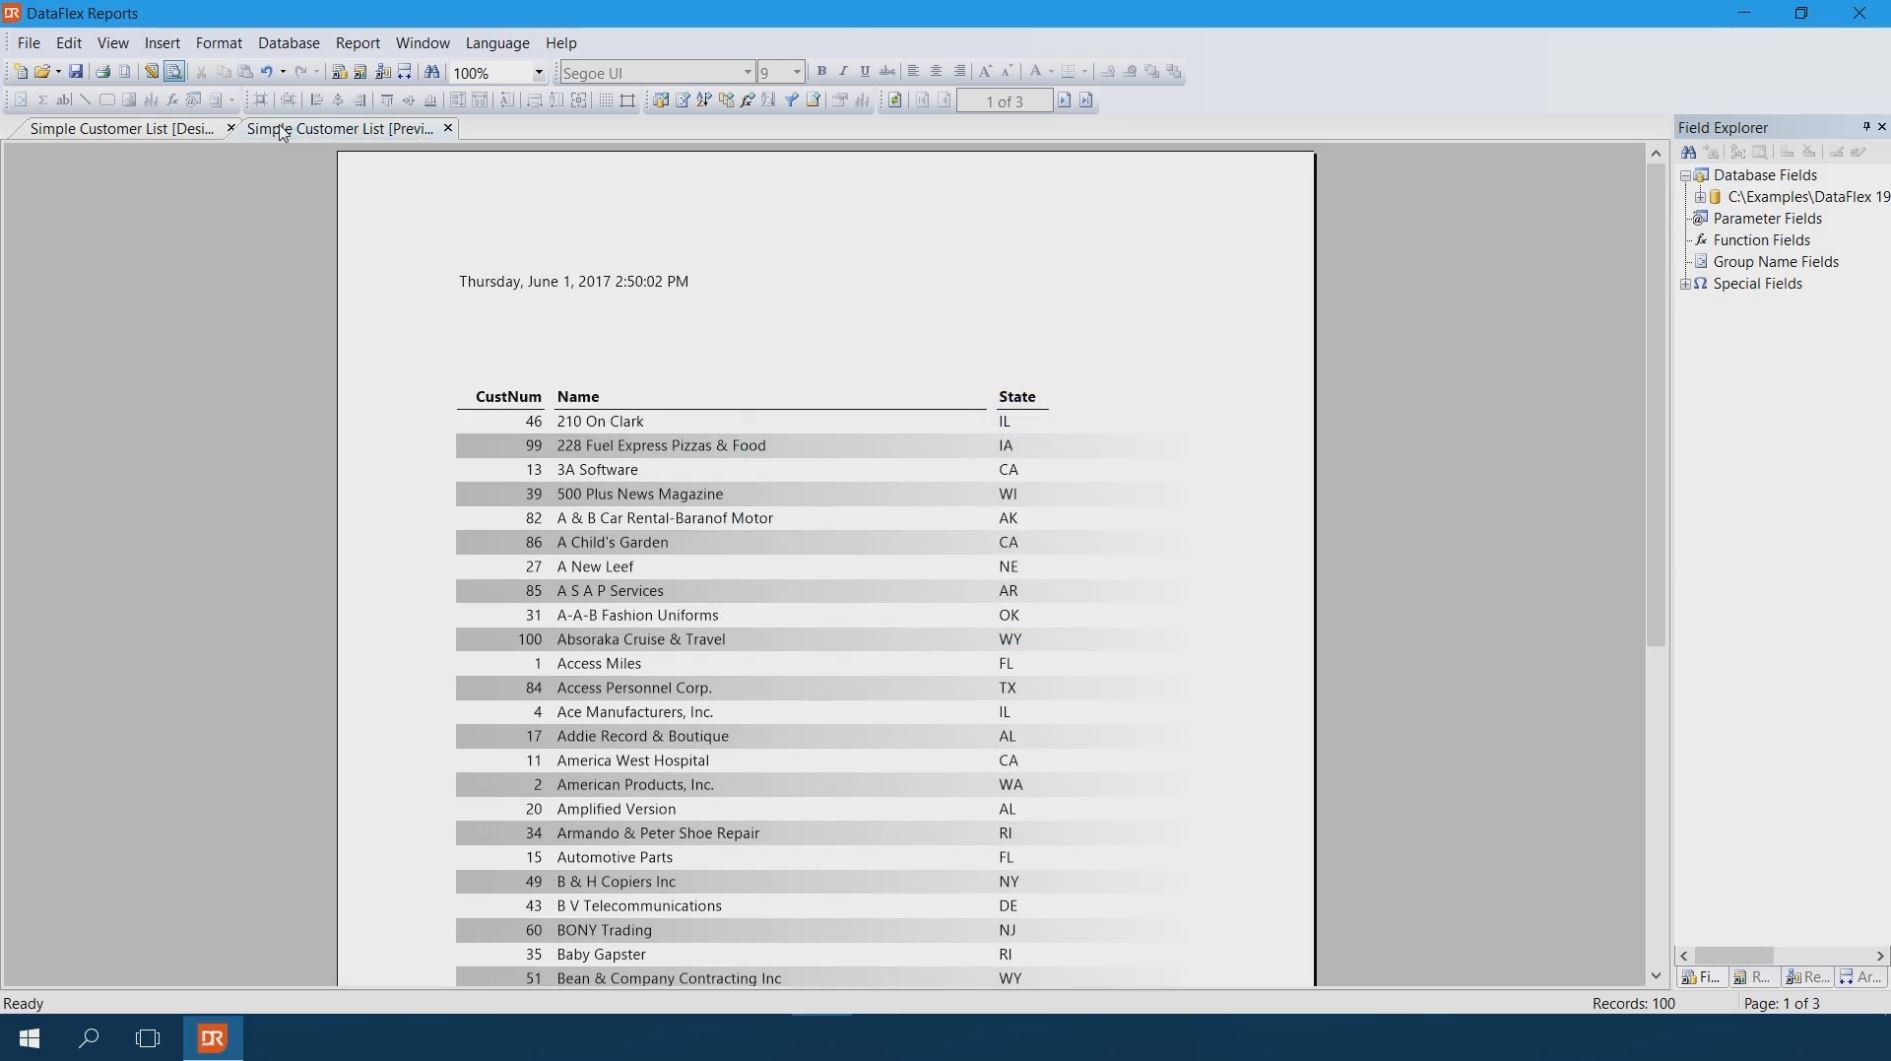
Go back to the preview. Every other row has an alternating color.
To add a gradient in the color, go back to the Section expert, and change the 'Gradient Type' to 'Horizontal'.
In the preview all changes are shown.