DataFlex Reports – Charts
Lesson – Charts
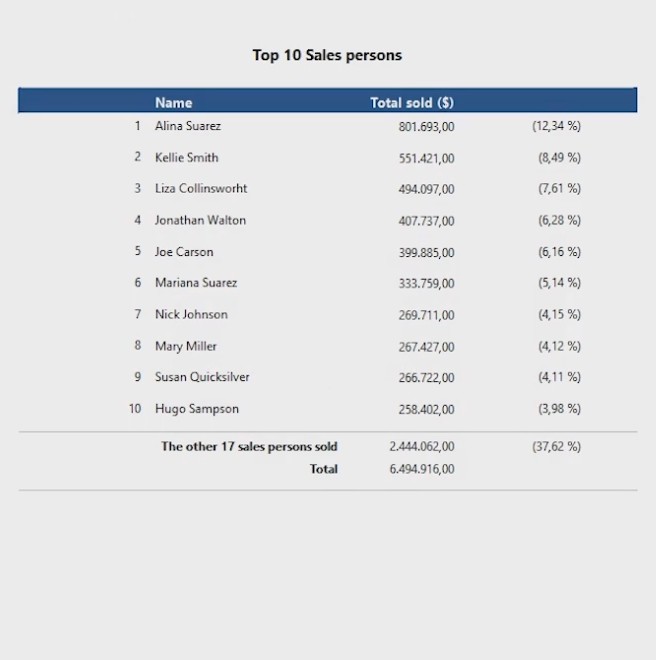
For this example we have a fictional top 10 list of sales persons. The report now provides a simple list we are going to add a chart below the list to visualize the top 10.
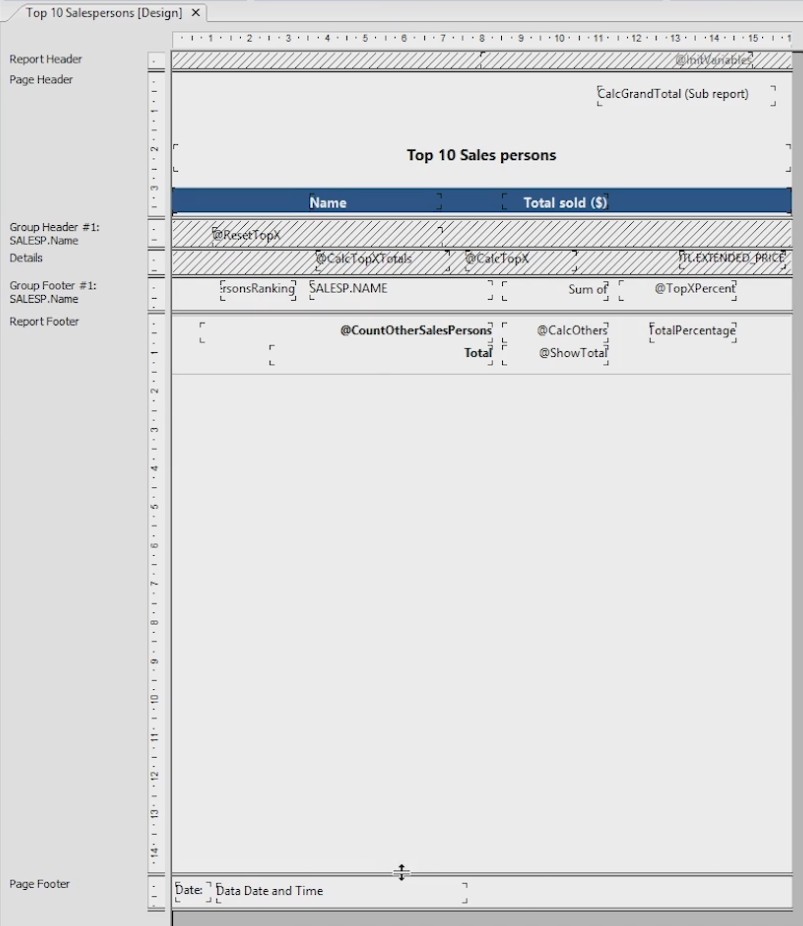
- Make room where you want to add a chart, in this case the ‘Report Footer’
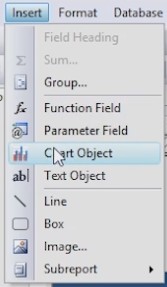
- Insert a chart by pressing the ‘Insert Chart’ button, or select ‘Chart Object’ from the insert menu.
- When clicked, an area can be selected where the chart needs to be placed.

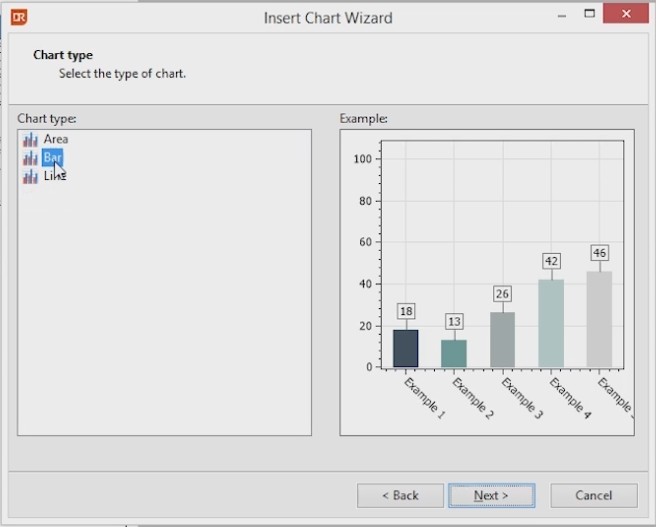
- After selecting the area, the ‘Instant Wizard’ comes up.
- Select the desired chart type, for example the ‘Bar’ chart.
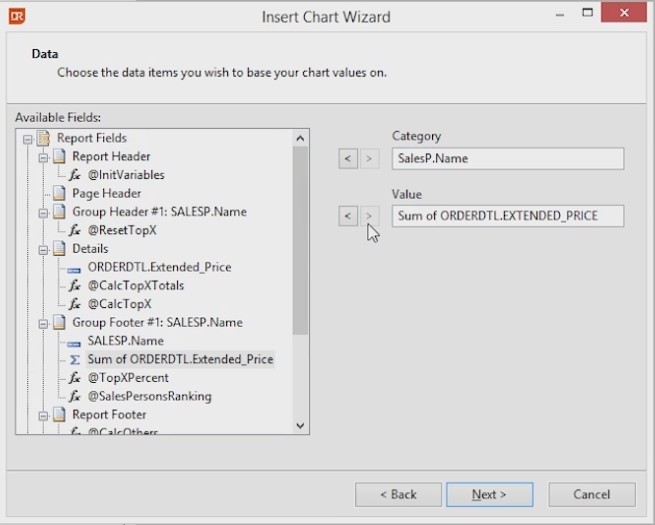
- Select the data fields on which the chart values will be based upon, the data fields we will use for this example are already present in the report. So open the report fields tree and select the SALESP.name and Sum of ORDERDTL.EXTENDED_Price fields.
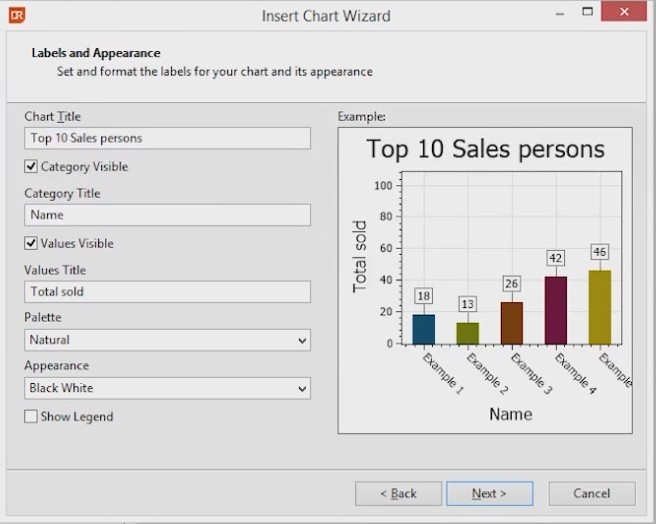
- In the next step you can change the appearance of the chart, for example the Chart and Access titles and the color pallet.
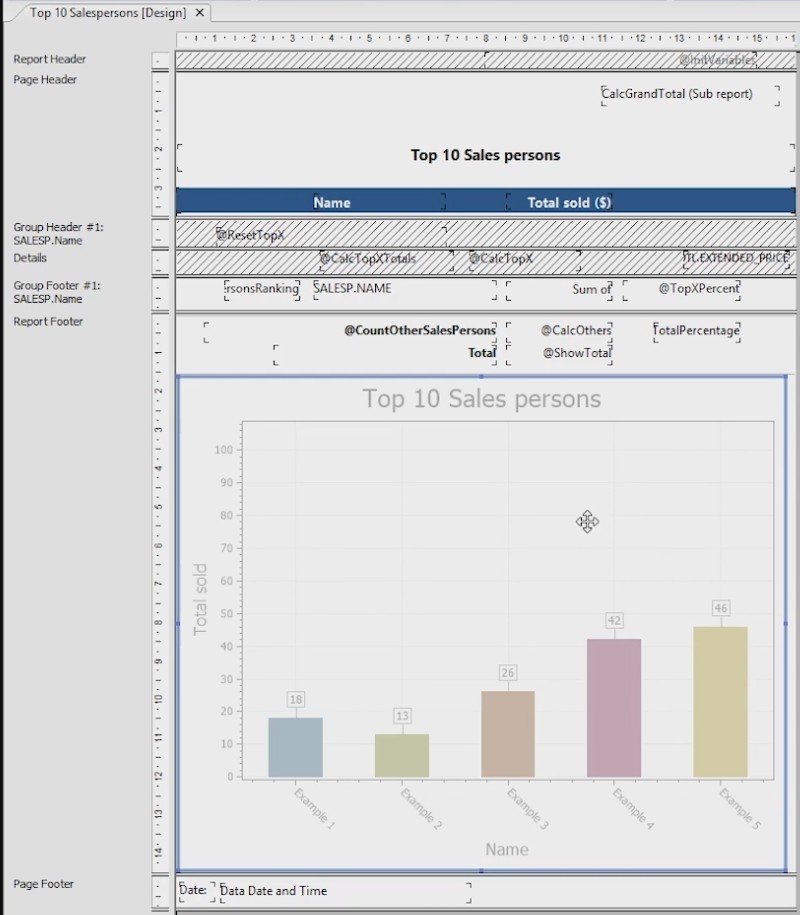
- Finish the wizard to preview the chart in the report design.
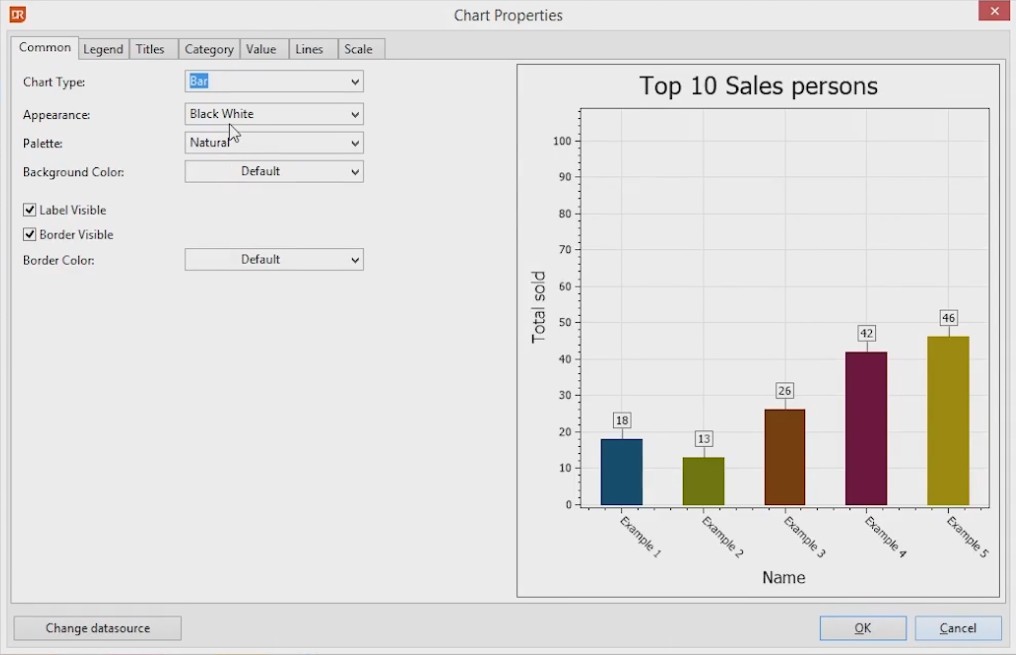
- Fine tune the chart by pressing the right mouse button and select chart properties.
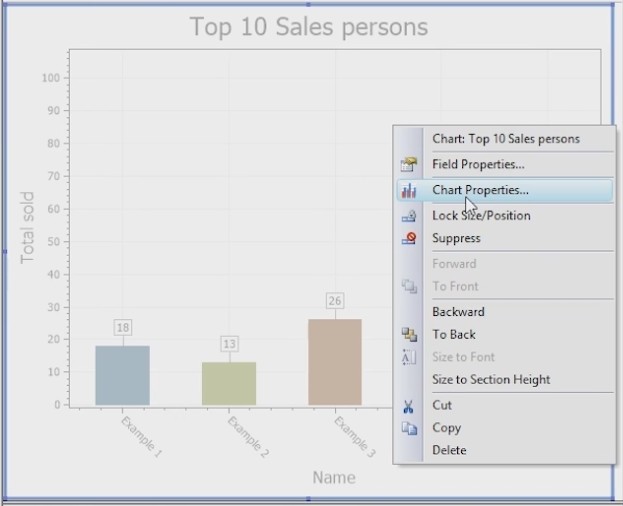
- Edit properties like appearance, chart legend, chart access and scale or change the data source.
- View the chart with the data by using the preview mode.
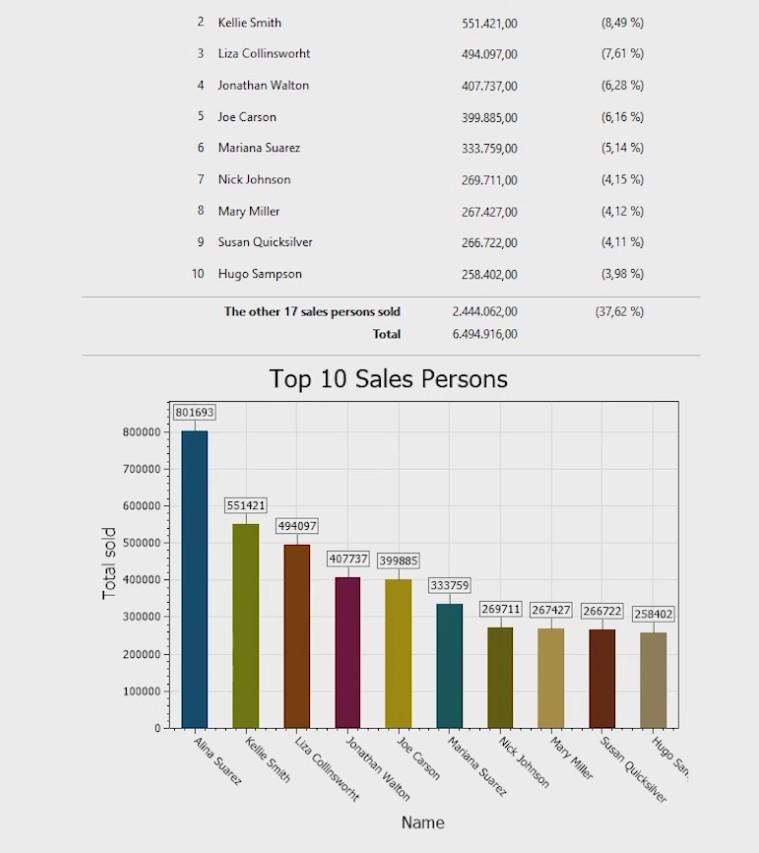
- This is how you create a bar chart in a report. Other charts work in the same way.
- In DataFlex Reports 4.0 there are 4 types of charts that you can use: Area, bar, line and point charts. Now you can easily visualize your data and gain new insights and as they say, a picture paints a thousand words.


